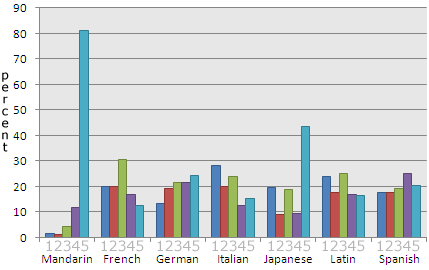
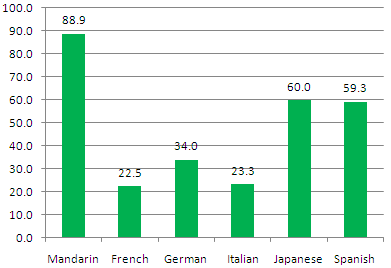
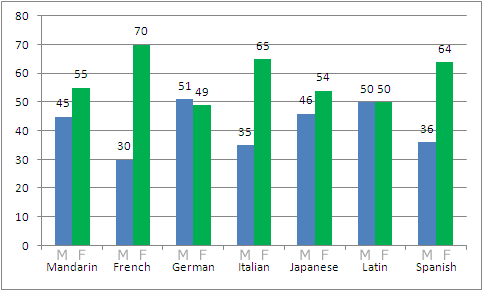
 From the way the U.S. media talk about the boom in Mandarin classes, it’s easy to get the impression that Mandarin is about to become the most studied language in the United States. So I offer the following overdue reality check.
The data come from the results of a large survey of foreign-language enrollments in U.S. post-secondary schools. The survey was conducted by the Modern Language Association. I started work on this post when the results were released in November 2007; but, well, I got distracted.
This post has lots of tables and figures, so for those who don’t want to scan through everything I offer some basic points up front.
- Spanish has more enrollments than all other foreign languages put together.
- By far the biggest enrollment boom since 1990 has not been for Mandarin but for American Sign Language.
- The boom in enrollments in Arabic also surpasses that for Mandarin.
- Mandarin is indeed growing in popularity — but in recent years only at the undergraduate level.
- Japanese continues to be more popular than Mandarin, though by an ever-smaller margin.
- Mandarin is the seventh most studied foreign language in U.S. post-secondary schools, behind Spanish (which leads Mandarin by a ratio of 16:1), French, German, American Sign Language, Italian, and Japanese.
- Relatively speaking, enrollments in foreign languages are much lower than they were 30 years ago.
A few summary remarks of my own:
- I don’t expect the high growth rates for Mandarin to continue for many more years unless the programs are dumbed down (in which case they wouldn’t count for much) or Pinyin gains a much more prominent role in Mandarin pedagogy (and not just at the introductory level). The difficulties of Chinese characters will help keep numbers down, as will the eventual realization that learning Mandarin isn’t an easy ticket to riches (or even a ticket to riches at all).
- Japanese received a big boost in the 1980s, when the media cranked out story after story about the power of Japan’s rising economy and the need to learn the language. Yet Japanese didn’t become the next big world language. I predict a similar path for Mandarin.
- A high percentage of those taking Mandarin classes in U.S. high schools are students who are both ethnically Chinese and already familiar with the language. The MLA didn’t provide figures on that for post-secondary students. But I would be surprised if such “heritage” students don’t represent a higher percentage of those in Mandarin language courses than heritage students in most other language classes.
OK, now on to some details.
Look below at the growth for American Sign Language since 1990. If Mandarin had had that sort of growth (4,820 percent!) the pundits would no doubt be telling us that the Chinese had already taken over the planet and were going to rule the entire galaxy within the next decade. (And don’t get me started about the supposed Mandarin in Serenity/Firefly.) But American Sign Language just doesn’t seem to get the same sort of respect, despite the fact that it still has more than 50 percent more enrollments than Mandarin. Arabic, which has also had a much faster growth rate than that of Mandarin, hasn’t received the same level of hype either.
Growth in Enrollments: in declining order of growth from 1990 to 2006
| Enrollments | 1990 | 2006 | % Growth 2002-06 | % Growth 1990-2006 |
|---|---|---|---|---|
| American Sign Language | 1,602 | 78,829 | 29.7 | 4820.7 |
| Arabic | 3,475 | 23,974 | 126.5 | 589.9 |
| Korean | 2,286 | 7,145 | 37.1 | 212.6 |
| Mandarin | 19,490 | 51,582 | 51.0 | 164.7 |
| Hebrew | 12,995 | 23,752 | 4.2 | 82.8 |
| Portuguese | 6,211 | 10,267 | 22.4 | 65.3 |
| Italian | 49,699 | 78,368 | 22.6 | 57.7 |
| Spanish | 533,944 | 822,985 | 10.3 | 54.1 |
| Japanese | 45,717 | 66,605 | 27.5 | 45.7 |
| French | 272,472 | 206,426 | 2.2 | -24.2 |
| German | 133,348 | 94,264 | 3.5 | -29.3 |
| Russian | 44,626 | 24,845 | 3.9 | -44.3 |
| Total | 1,125,865 | 1,489,042 | 12.7 | 32.3 |
Change in enrollments over time: in declining order of total enrollment for 2006
| Change between Surveys | 1995-98 | 1998-2002 | 2002-06 |
|---|---|---|---|
| Spanish | 8.3% | 13.7% | 10.3% |
| French | -3.1% | 1.5% | 2.2% |
| German | -7.5% | 2.3% | 3.5% |
| American Sign Language | 165.3% | 432.2% | 29.7% |
| Italian | 12.6% | 29.6% | 22.6% |
| Japanese | -3.5% | 21.1% | 27.5% |
| Mandarin | 7.5% | 20.0% | 51.0% |
| Russian | -3.8% | 0.5% | 3.9% |
| Arabic | 23.9% | 92.3% | 126.5% |
| Hebrew * | 20.6% | 44.0% | 4.2% |
| Portuguese | 6.0% | 21.1% | 22.4% |
| Korean | 34.0% | 16.3% | 37.1% |
| Total | 5.0% | 16.6% | 12.7% |
* Modern and Biblical Hebrew combined
Below: Russian may not have the top number of enrollments, but it certainly has some motivated students, given the high numbers of them in advanced courses.
Enrollments in Introductory-Level Courses vs. Enrollments in Advanced-Level Courses
| Intro Enr. | Advanced Enr. | Total Enrollment | Ratio of Intro Enr. to Advanced Enr. | |
|---|---|---|---|---|
| Russian | 17,527 | 6,569 | 24,096 | 2.67:1 |
| Portuguese | 7,387 | 2,422 | 9,809 | 3.05:1 |
| German | 72,434 | 18,758 | 91,192 | 3.86:1 |
| French | 160,736 | 40,927 | 201,663 | 3.93:1 |
| Korean | 5,511 | 1,397 | 6,908 | 3.94:1 |
| Greek, Ancient | 13,250 | 3,176 | 16,426 | 4.17:1 |
| Mandarin | 41,193 | 9,262 | 50,455 | 4.45:1 |
| Spanish | 669,432 | 142,602 | 812,034 | 4.69:1 |
| Japanese | 55,161 | 10,585 | 65,746 | 5.21:1 |
| Latin | 26,787 | 4,383 | 31,170 | 6.11:1 |
| Hebrew, Modern | 7,665 | 1,250 | 8,915 | 6.13:1 |
| Arabic | 20,571 | 2,463 | 23,034 | 8.35:1 |
| Italian | 69,757 | 7,593 | 77,350 | 9.19:1 |
| Hebrew, Biblical | 7,854 | 705 | 8,559 | 11.14:1 |
| American Sign Language | 72,694 | 5,249 | 77,943 | 13.85:1 |
| Other languages | 27,836 | 3,478 | 31,314 | 8.00:1 |
| Total | 1,275,795 | 260,819 | 1,536,614 | 4.89:1 |
One thing I find particularly troubling is that the number of graduate students studying Mandarin has fallen. (Please click on the link in the previous sentence, since the relevant table is too wide to fit on this page.) The much-ballyhooed but also much-deserved increase in students studying Mandarin has all been at the undergraduate level. Given that the grad enrollment as a percentage of total enrollment for Mandarin is about the same as that for French (2.63 percent and 2.73 percent, respectively) it might appear that Mandarin has simply reached a “normal” ratio in this regard. But native speakers of English generally need much more time to master Mandarin than to master French. Simply put, four years, say, of post-secondary study of French provides students with a much greater level of fluency than four years of post-secondary study of Mandarin.
Also, there is a great deal more work that needs to be done in terms of translations from Mandarin. I do not at all mean to belittle the work being done in French — or in any other language. In fact it pains me that the MLA’s list of languages being studied included neither Old French nor Provençal, both of which I have studied and love dearly. I just mean that Mandarin has historically been underrepresented in U.S. universities given the number of speakers it has and its body of texts that have not yet been translated into English. U.S. universities need to be producing many more qualified grad students who can handle this specialized work. And right now, unfortunately, that’s not happening.
Post-Secondary Enrollments in Select Sino-Tibetan Languages and Classical Japanese: 2002, 2006
| Two-Year Colleges | Undergrad Programs | Grad Programs | Total | |||||
|---|---|---|---|---|---|---|---|---|
| Language | 2002 | 2006 | 2002 | 2006 | 2002 | 2006 | 2002 | 2006 |
| Cantonese | 47 | 96 | 128 | 82 | 5 | 0 | 180 | 178 |
| Literary Sinitic | 0 | 0 | 56 | 101 | 18 | 12 | 74 | 113 |
| Japanese, Classical | 0 | 0 | 8 | 23 | 11 | 7 | 19 | 30 |
| Taiwanese | 0 | 0 | 34 | 21 | 13 | 0 | 47 | 21 |
| Tibetan | 0 | 0 | 43 | 56 | 35 | 64 | 78 | 120 |
| Tibetan, Classical | 0 | 0 | 8 | 11 | 20 | 33 | 28 | 44 |
The figures in the table above are probably too low. Literary Sinitic (“classical Chinese”) is probably especially underrepresented because often too little differentiation is given between it and modern standard Mandarin. But at least the numbers can provide minimum figures.
Enrollments in Introductory Classes: 2-Year Schools vs. 4-Year Schools
| Language | Ratio of Intro Enr. in 2-Year Schools to Intro Enr. in 4-Year Schools |
|---|---|
| Greek, Ancient | 0.00:1 |
| Hebrew, Biblical | 0.01:1 |
| Latin | 0.04:1 |
| Hebrew, Modern | 0.07:1 |
| Portuguese | 0.11:1 |
| Russian | 0.15:1 |
| German | 0.20:1 |
| Italian | 0.23:1 |
| French | 0.24:1 |
| Arabic | 0.26:1 |
| Mandarin | 0.26:1 |
| Korean | 0.28:1 |
| Japanese | 0.39:1 |
| Spanish | 0.49:1 |
| American Sign Language | 1.47:1 |
| Other languages | 0.24:1 |
American Sign Language sticks out here as the only language that more people take at the introductory level at junior colleges than at universities. Roughly twice as many people take introductory Spanish in universities as at junior colleges. Introductory Japanese classes are surprisingly popular at the two-year college level, well above the level for introductory Mandarin, though Mandarin is not unpopular itself.
Course Enrollments in Some Asian and Pacific Languages
| Language | 1998 | 2002 | 2006 | % Change 2002–06 |
|---|---|---|---|---|
| Hindi/Urdu | 1314 | 2009 | 2683 | 33.55 |
| Vietnamese | 899 | 2236 | 2485 | 11.14 |
| Tagalog/Filipino | 794 | 1142 | 1569 | 37.39 |
| Sanskrit | 363 | 487 | 607 | 24.64 |
| Hmong | 15 | 283 | 402 | 42.05 |
| Thai | 272 | 330 | 307 | -6.97 |
| Indonesian | 223 | 225 | 301 | 33.78 |
| Samoan | 207 | 201 | 280 | 39.30 |
| Cantonese | 39 | 180 | 178 | -1.11 |
| Tibetan | 80 | 78 | 120 | 53.85 |
| Literary Sinitic | 32 | 74 | 113 | 52.70 |
| Pashto | – | 14 | 103 | 635.71 |
| Punjabi | 32 | 99 | 103 | 4.04 |
| Total | 4270 | 7358 | 9251 | 25.73 |
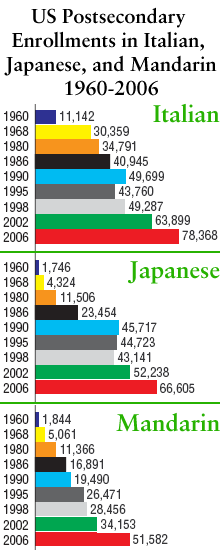
Although more U.S. postsecondary students are studying languages other than English than ever before, that’s unfortunately not because U.S. students as a whole have finally embraced the study of languages. Rather, there are simply more students now. Relatively speaking, enrollments in foreign languages are much lower than they were 30 years ago.
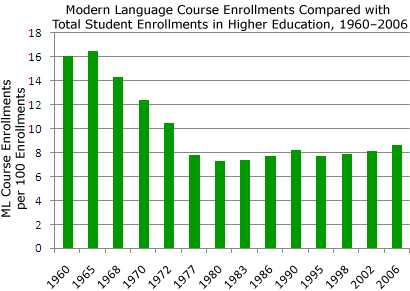
If “ancient” foreign languages such as Latin and Ancient Greek were included in the graph, the imbalance between the 1960s and the present in foreign-language enrollments would be even greater.
source: Enrollments in Languages Other Than English in United States Institutions of Higher Education, Fall 2006 (PDF), MLA, November 13, 2007

