Recent years have been difficult for postsecondary foreign language programs in the United States, with enrollments down 16.6% overall between fall 2016 and fall 2021. Anecdotal evidence points to even steeper declines since then.
This post provides a look at the some of the numbers from the most recent report by the Modern Language Association, focusing especially on the case of Chinese/Mandarin, with some other languages (esp. Japanese) tossed in by way of comparison.
Among the fifteen most commonly taught languages other than English, only three — Korean, American Sign Language, and Biblical Hebrew — showed gains, at 38.3%, 9.1%, and 0.8%, respectively.
Thus, Mandarin and Japanese are among those in decline. Although in total enrollments Mandarin is now ahead of Italian, and Japanese has moved ahead of German, that’s simply because those two Asian languages didn’t fall as far as those two European ones.
Enrollments in Chinese, Italian, Arabic, Latin, and Korean
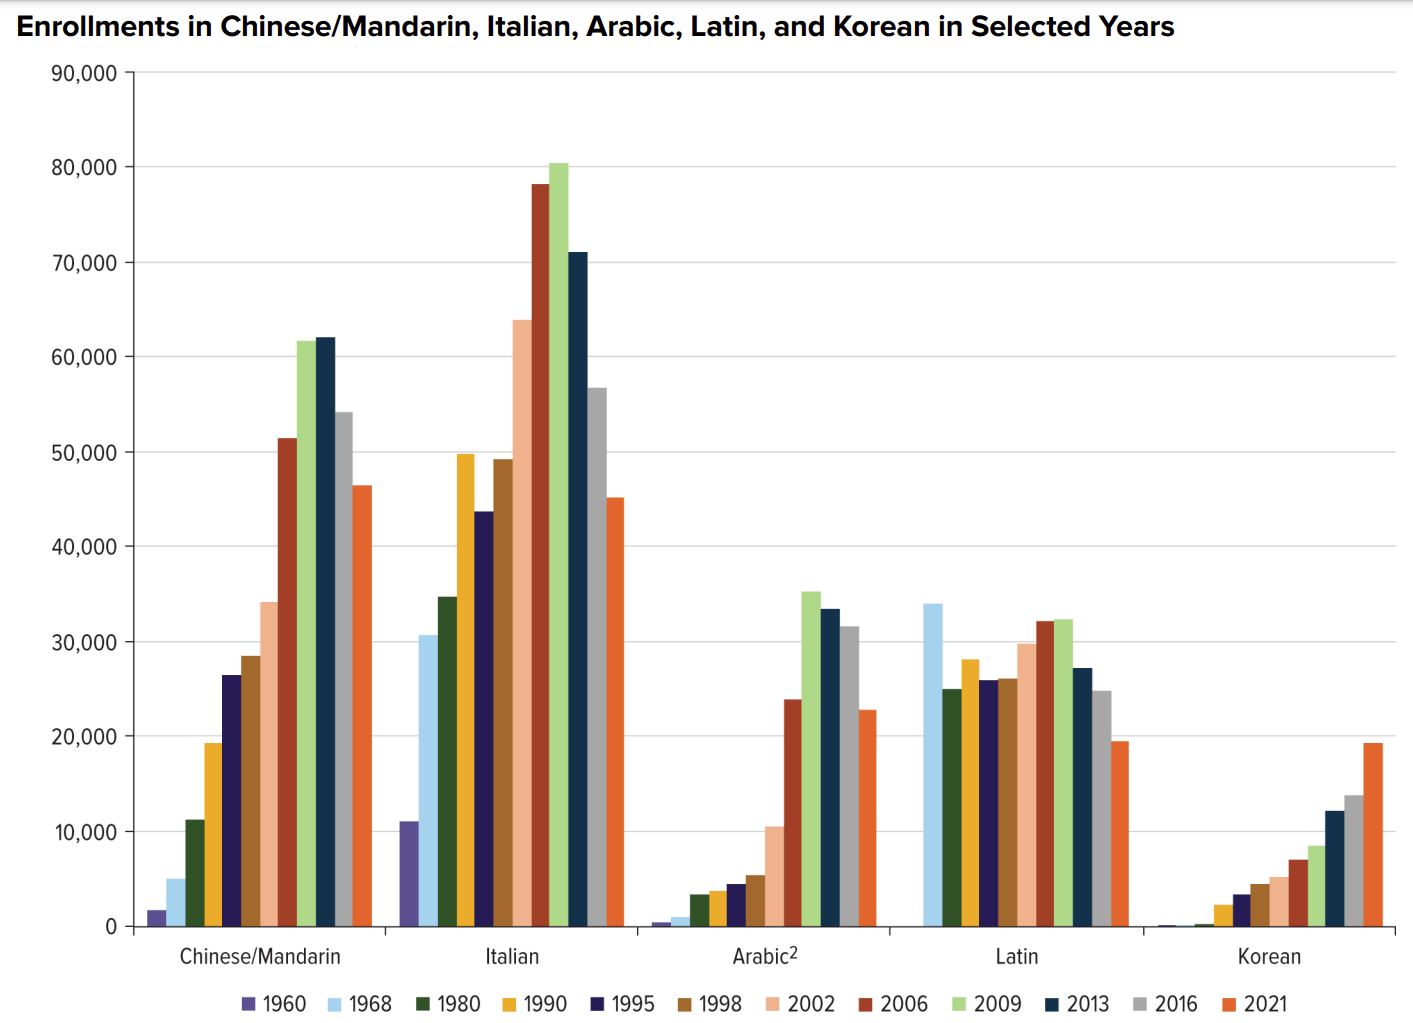
(source: MLA report)
From the MLA report:
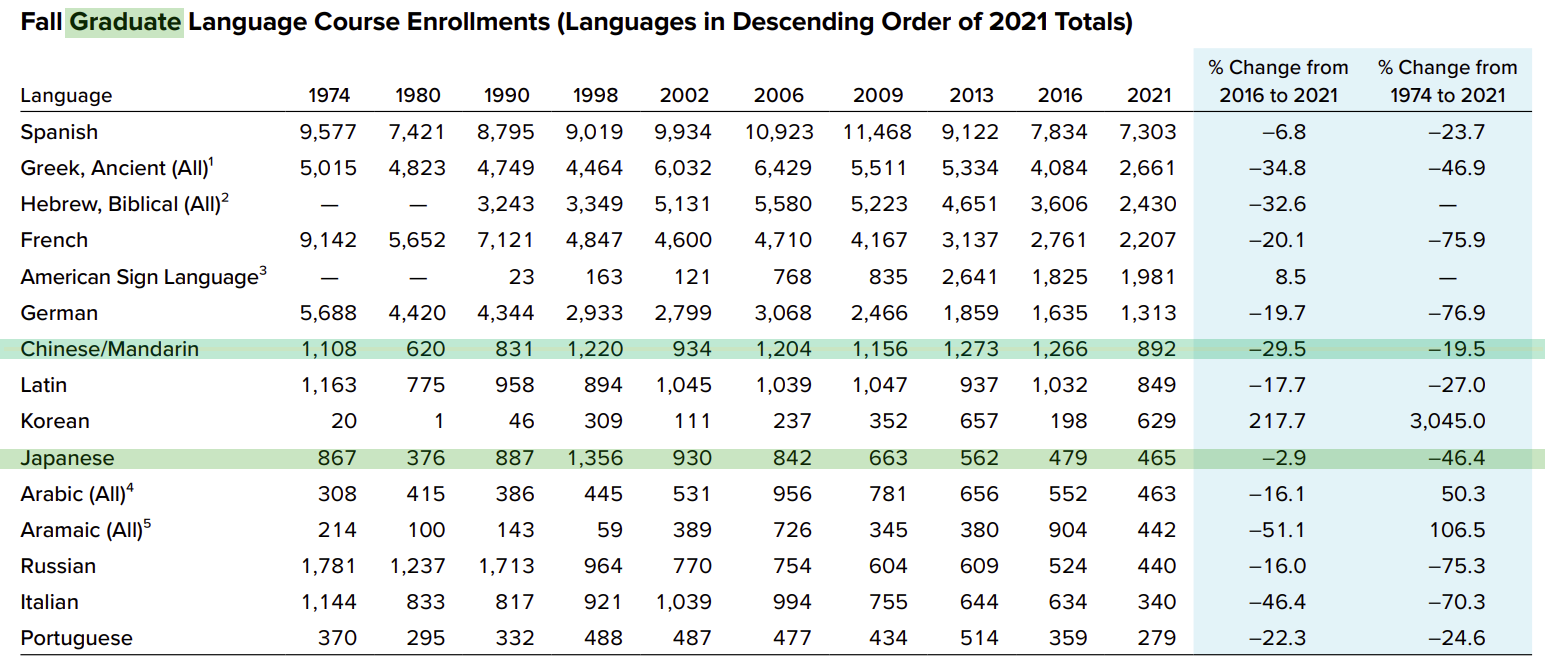
Chinese/Mandarin enrollments … showed steep declines…. Chinese/Mandarin enrollments fell 14.3% overall and 23.9% at two-year schools, 12.5% at four-year schools, and 29.5% at the graduate level…. Chinese/Mandarin enrollments have been dropping at two-year institutions since 2009, and at four-year institutions since 2013. Graduate enrollments in Chinese/Mandarin have remained fairly steady for the last twenty years; the drop from 2016 to 2021, from 1,266 to 892, is the first time graduate enrollments in Chinese/Mandarin have fallen below 1,000 since 2002.
From the five uses of “Chinese/Mandarin” in the previous paragraph, longtime readers of Pinyin News will note that the MLA acted upon my earlier recommendation to aggregate those two terms rather than treat them separately. But don’t worry: the MLA report doesn’t give the wordy “Chinese/Mandarin” every time in its report. (Although in general use I prefer “Mandarin,” in this post I often use “Chinese” simply to aid people making Google searches.)
Now for some graphs and tables, some directly from the MLA report, others I made using the MLA’s data.
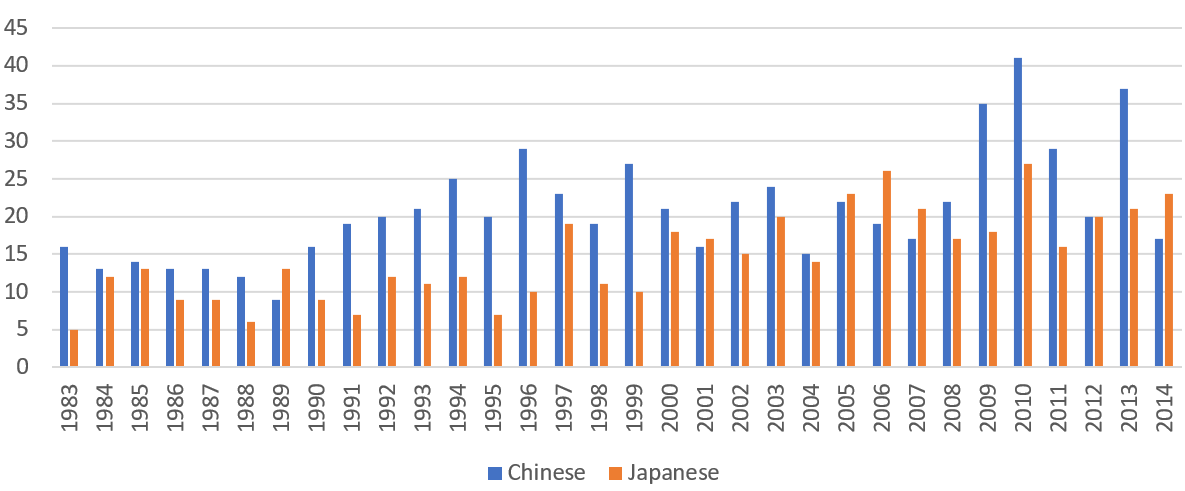
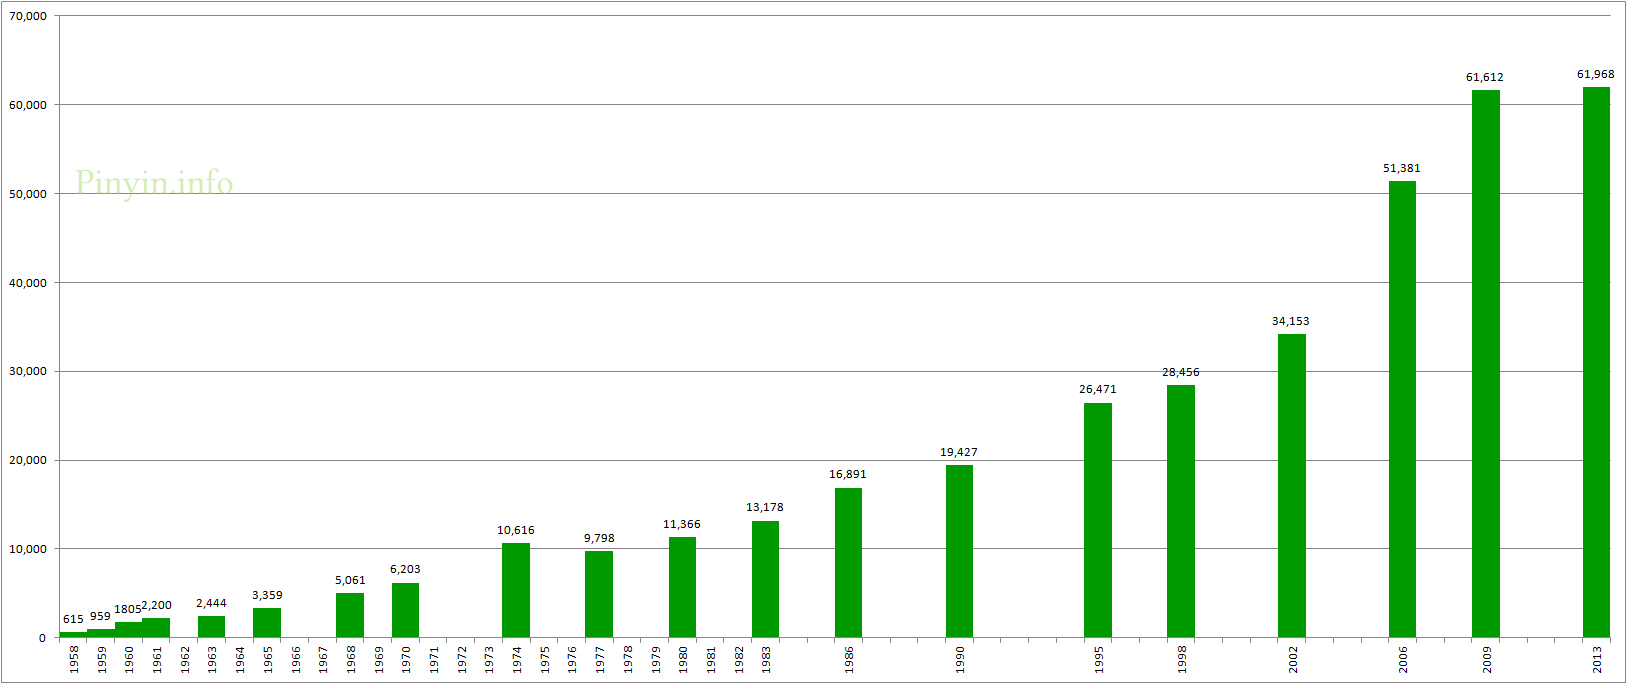
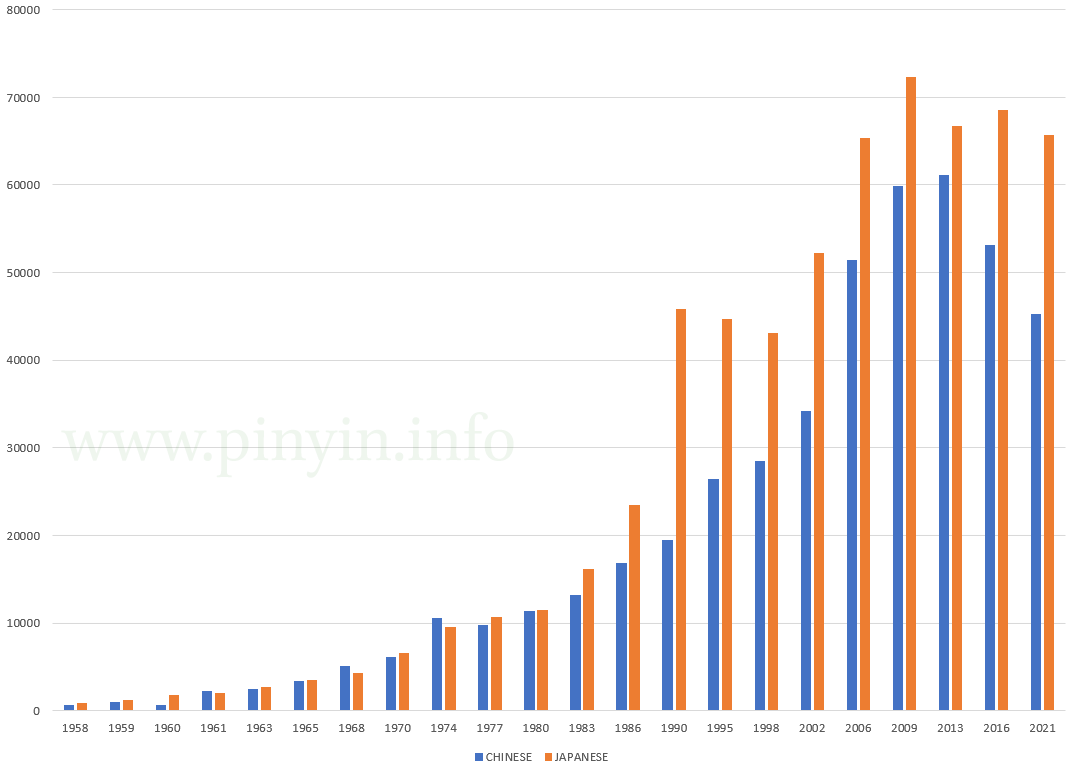
US postsecondary enrollments in Chinese and Japanese, 1958–2021
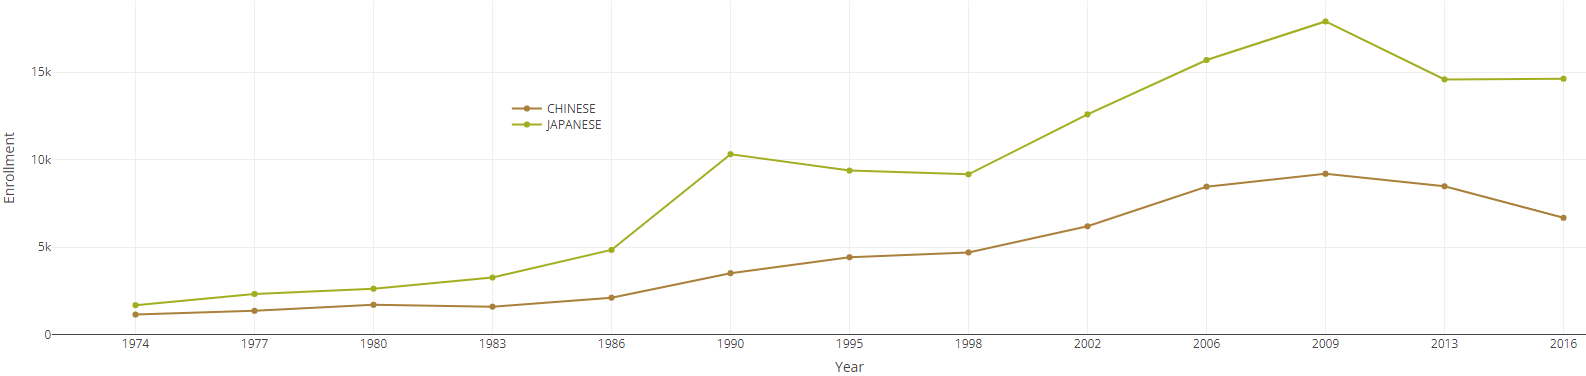
Chinese and Japanese enrollments in two-year colleges, 1974–2016
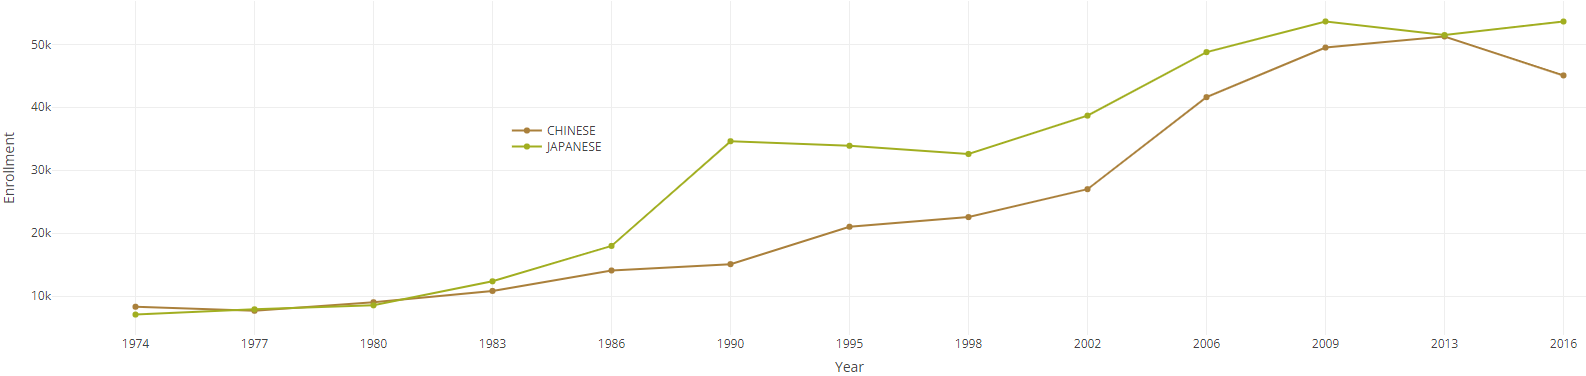
Chinese and Japanese enrollments in four-year universities, 1974–2016
Graduate course enrollments over time (emphasis for Chinese and Japanese added)
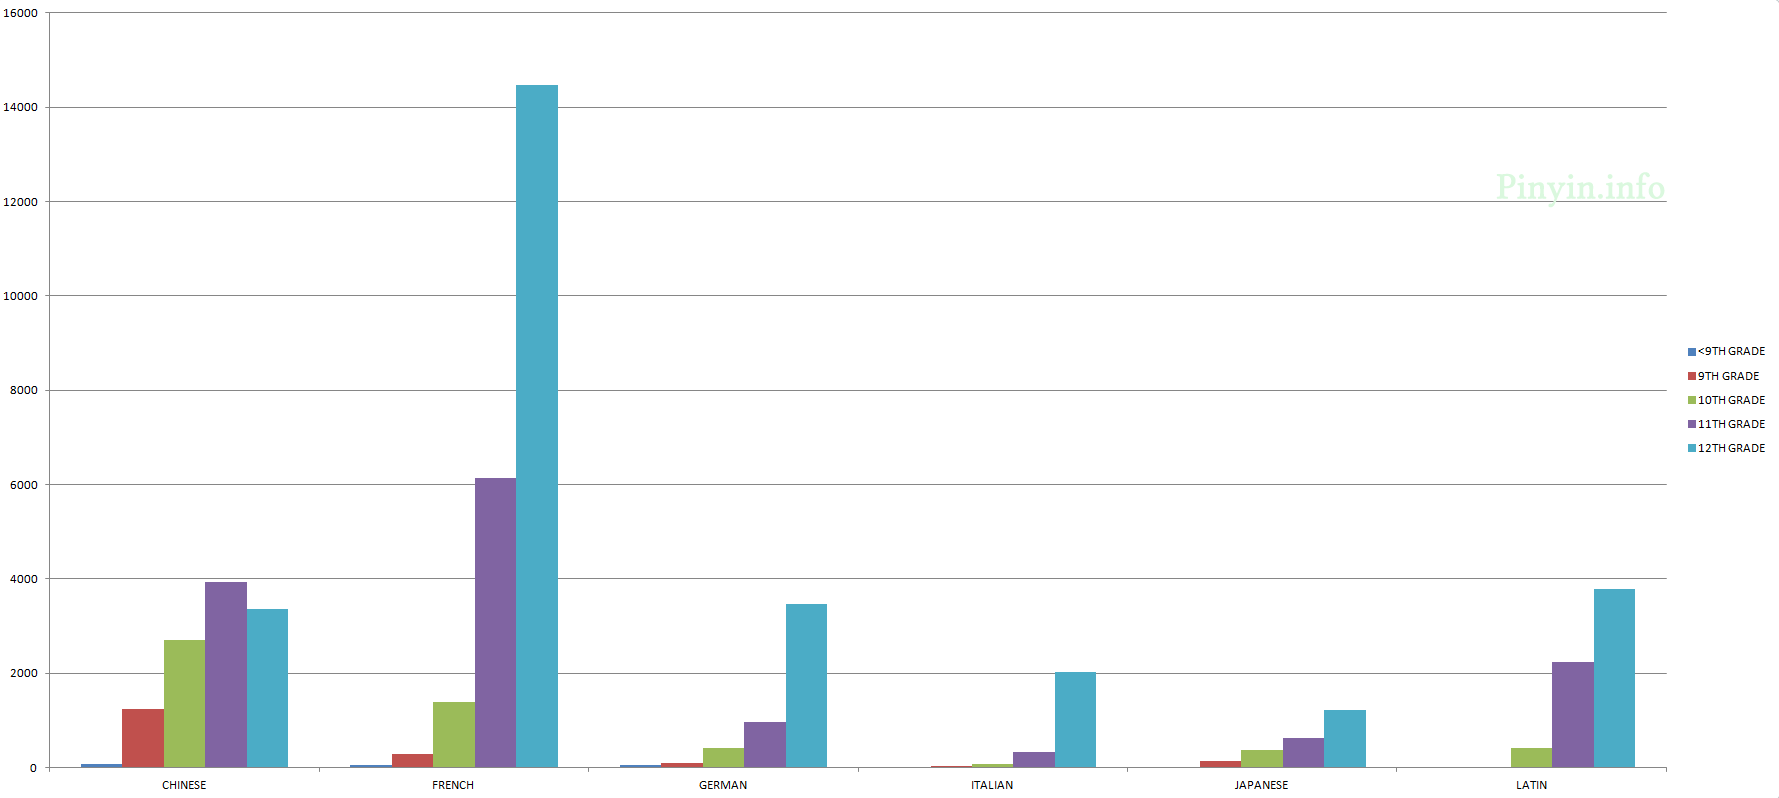
In one encouraging sign for Mandarin, it had a 3:1 ratio of introductory to advanced undergraduate enrollments, making it one of just five languages that had a 4:1 or better ratio, along with Biblical Hebrew (2:1), Portuguese (3:1), Russian (3:1), and German (4:1). This is important because on average it takes more time for native speakers of English to reach the same level in Mandarin than they might achieve in, say, two years of French.
Also, although the number of enrollments is down for Mandarin, that language beat the reduction trend by having a slight increase in the number of institutions offering it at the graduate level: 54 in 2021, up from 52 in 2009. On the other hand, Chinese enrollments overall were reported by 105 fewer institutions in the survey.
As this table from the MLA report shows, Mandarin programs around the United States have been decreasing, stable, or increasing at about the same rates as programs for other foreign languages — which is to say, mainly decreasing. Japanese, however, is continuing to do well given the recent environment.
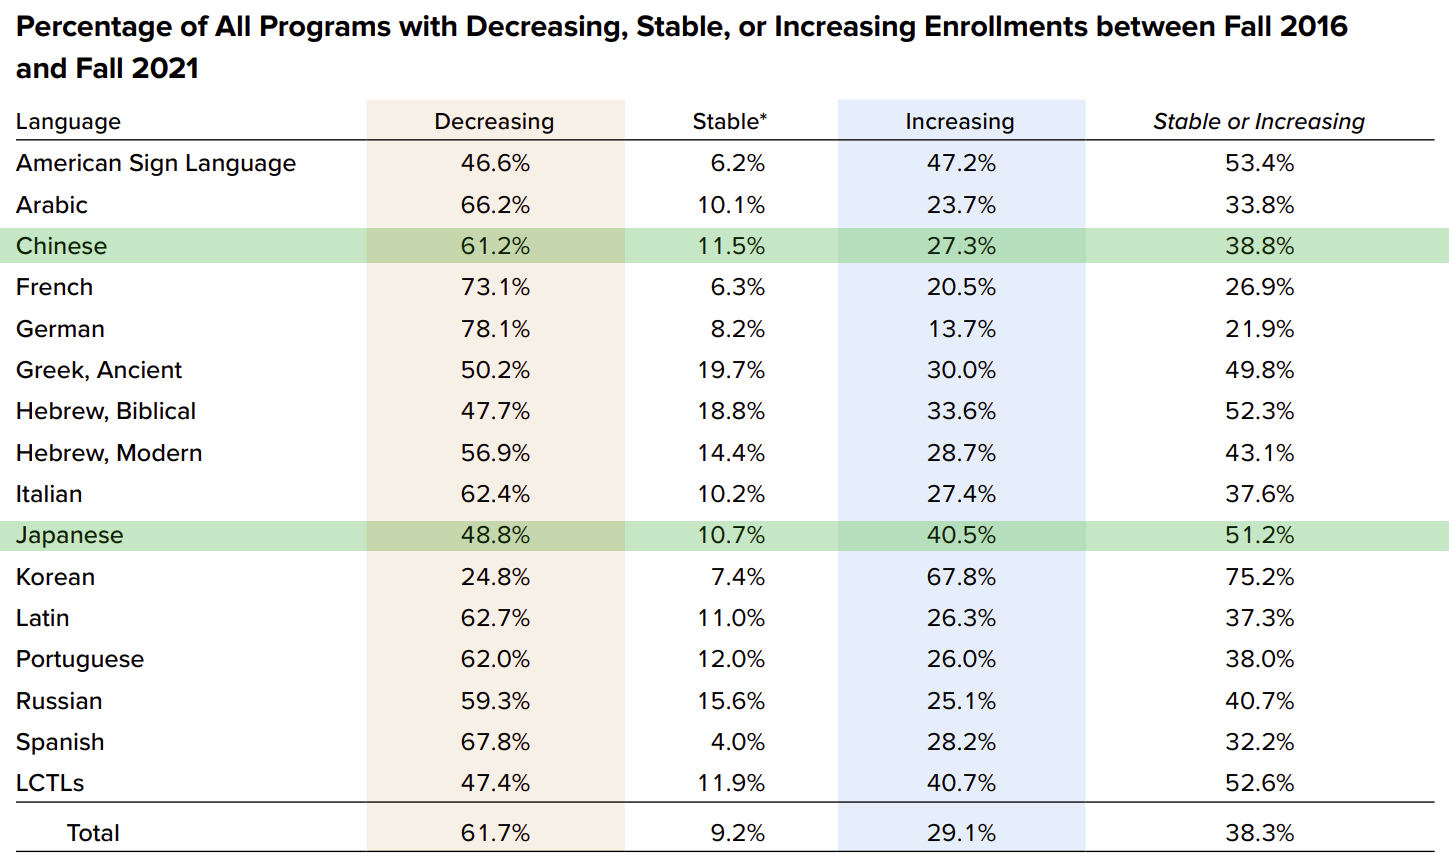
The figures are about the same for introductory programs, so I won’t bother to reproduce that table (12b).
sources:
Further reading:
- Trends in Foreign Language enrollments, Language Log, November 20, 2023 (see also the comments).
- US doctorates in Chinese and Japanese over time, Pinyin News, November 23, 2023.
- MLA undercounts enrollments in ‘Chinese’ classes, Pinyin News, March 9, 2018.
- US postsecondary enrollments in Mandarin fall, Pinyin News, March 9, 2018.
- Number of Chinese majors in U.S. universities holding steady, Pinyin News, October 15, 2015.
- US grad-level enrollments in Japanese continue long decline, Pinyin News, March 27, 2015.
- US grad enrollments in Mandarin fall, Pinyin News, February 16, 2011.
- US post-secondary enrollments in foreign languages and the position of Mandarin, Pinyin News, August 18, 2008.