Cantonese version of Wordle

Wordle is an interesting word game that has gone viral, so you’ve probably already heard of it. I discovered it a few weeks ago through an article in the New York Times.

Now there’s a Cantonese version in romanization: Zidou.

screenshot of Zidou

Is there already a Mandarin version in Hanyu Pinyin or any other romanization system? If not, or if the only existing ones are based on syllables and not words, then there certainly should be

Further reading: Wordle: As word puzzle takes over the internet, Hong Kong professor creates Cantonese version. Hong Kong Free Press, January 29, 2022.

China attracting fewer and fewer U.S. study-abroad students

China is continuing to decline as a destination for U.S. study-abroad students, slipping from fifth place to sixth (behind Britain, Spain, Italy, France, and Germany; with Ireland, Australia, Costa Rica, and Japan completing the top ten).

This likely indicates that the craze for learning Mandarin has already peaked. Greater awareness of the unhealthy levels of pollution in China may also be a factor.

chart showing how US enrollments in study-abroad programs in China were low in the 1990s (about 2000 students), grew sharply in the 2000s (to almost 15000 in 2011), and have been declining ever since
Note: The dip in the 2002–2003 school year was a result of worries about the outbreak of SARS.

Meanwhile, almost all other parts of East Asia saw increases in 2015–2016 over 2014–2015:

Destination Students in 2014-15 Students in 2015-16 % Change
China 12,790 11,688 -8.6
Hong Kong 1,508 1,612 6.9
Japan 6,053 7,145 18.0
Macau 3 4 33.3
Mongolia 71 71 0.0
South Korea 3,520 3,622 2.9
Taiwan 880 980 11.4

sources:

Additional reading:

Attitudes in Hong Kong toward Mandarin and Cantonese

About a year and a half ago, when I last posted on a recurring poll of what people in Hong Kong think of Mandarin and Cantonese (as well as other “icons” relevant to Hong Kong) I predicted that “the next survey will show aversion to Mandarin surpassing affection for and pride in that language.”

As of the 2016 survey, aversion to Mandarin was at 17.7 percent of the population, whereas affection for and pride in Putonghua, as the survey labels it, were at 20.1 percent and 17.8 percent, respectively. So I was wrong.

Nevertheless, Mandarin certainly isn’t winning any popularity contests in Hong Kong these days. Although the levels of those averse to Mandarin and those proud of it are now just about equal, among Hong Kongers pride in Mandarin is lower than pride in any other surveyed item. Affection toward Mandarin was similarly lower, avoiding the bottom spot only because the Chinese army came in less than one point lower.

Attitudes in Hong Kong toward Mandarin and Cantonese, 2012-2016

Detail of the above chart, 2012-2016

Generally speaking, positive feelings for Cantonese are higher — usually much higher — than positive feelings for other Hong Kong icons, while negative feelings about Cantonese are much lower than for most other icons. On the other hand, feelings for Mandarin are more highly negative and less strongly positive than for most other icons.

sources and further reading:

Attitudes in Hong Kong toward Mandarin and Cantonese

In Hong Kong, aversion to Mandarin is continuing to grow, while pride in and affection for that language continue to fall, according to the results of a regular survey. The scores for all three have largely converged. I expect those trends to continue, so that the results from the next survey will show aversion to Mandarin surpassing affection for and pride in that language.

chart of opinions in Hong Kong toward Mandarin ('Putonghua') and Cantonese (Guangdonghua), showing favoribility  toward Mandarin decreasing and disgust with that language increasing.

Attitudes toward Cantonese were not covered by this survey until 2012. Attitudes toward English are still not surveyed in this study.

Feelings toward other “icons” of Hong Kong and China as a whole were also surveyed, so while the scores on Mandarin may to some extent reflect how people in Hong Kong feel about the People’s Republic of China, it’s important to note that even objects such as the PRC flag manage significantly better than Mandarin in public opinion.

I’m using the translations offered by the survey itself:

  • averse to: 抗拒
  • proud of: 自豪
  • affectionate toward: 親切

PRIDE
Pride in Mandarin (16.7 percent) is lower than pride in everything else in the survey except for the Hong Kong Central Government Offices, which came in at just 14.5 percent.

Pride in Cantonese (58.7 percent) is higher than pride in everything else in the survey except for the Night View of Victoria Harbour (65.2 percent).

AFFECTION
Affection toward Mandarin (17.7 percent) was third lowest, ahead of only the People’s Liberation Army (14.1 percent) and the Hong Kong Central Government Offices (14.3 percent).

Affection toward Cantonese (81.0 percent) was the by far the highest of all, followed by affection toward the Night View of Victoria Harbour (69.7 percent). Nothing else made it past the low 30s.

AVERSION
People in Hong Kong had the highest aversion to the People’s Liberation Army (26.7 percent). Mandarin tied for second with the Hong Kong Central Government Offices (both 16.2 percent).

Aversion to Cantonese (1.7 percent) was the lowest of any surveyed category.

The information in this post was derived from:

Related posts:

Popularity of Chinese character country code TLDs

Yesterday we looked at the popularity of the Chinese character TLD for Singapore Internet domains. Today we’re going to examine the Chinese character ccTLDs (country code top-level domains) for those places that use Chinese characters and compare the figures with those for the respective Roman alphabet TLDs.

In other words, how, for example, does the use of taiwan in traditional Chinese characters   .台灣 domains compare with the use of .tw domains?

Since, unlike the case with Singapore, I don’t have the registration figures, I’m having to make do with Google hits, which is a different measure. For this purpose, Google is unfortunately a bit of a blunt instrument. But at least it should be a fairly evenhanded blunt instrument and will be useful in establishing baselines for later comparisons.

A few notes before we get started:

  • Japan has yet to bother with completing the process for its own name in kanji (Japan, as written in kanji / Chinese characters), so it is omitted here.
  • Macau only recently asked for aomen in simplified Chinese characters    
  .澳门 and aomen in traditional Chinese characters    
  .澳門, so those figures are still at zero.
  • Oddly enough, there’s no taiwan_super in traditional Chinese characters   
  .臺灣 ccTLD, even though the Ma administration, which was in power when Taiwan’s ccTLDs went into effect, officially prefers the more complex form of taiwan_super in traditional Chinese characters   
  .臺灣 to taiwan in traditional Chinese characters   .台灣 — not to mention prefering it to taiwan in simplified Chinese characters    
  .台湾.
  Google Hits Percent of Total
MACAU    
.mo 18400000 100.00
aomen in simplified Chinese characters    
  .澳门 0 0.00
aomen in traditional Chinese characters    
  .澳門 0 0.00
TAIWAN    
.tw 206000000 99.86
taiwan in simplified Chinese characters    
  .台湾 67600 0.03
taiwan_super in traditional Chinese characters   
  .臺灣 0 0.00
taiwan in traditional Chinese characters   .台灣 230000 0.11
HONG KONG    
.hk 193000000 99.94
xianggang  in Chinese characters 
  .香港 118000 0.06
SINGAPORE    
.sg 97800000 100.00
xinjiapo  in Chinese characters 
  .新加坡 2 0.00
CHINA    
.cn 315000000 99.61
zhongguo in simplified Chinese characters  
  .中国 973000 0.31
zhongguo in traditional Chinese characters   
  .中國 251000 0.08

So in no instance does the Chinese character ccTLD reach even one half of one percent of the total for any given place.

Here are the results in a chart.

Graph showing that although China leads in domains in Chinese characters, they do not reach even one half of one percent of the total for China

Note that the ratio of simplified:traditional forms in China and Taiwan are roughly mirror images of each other, as is perhaps to be expected.

See also Platform on Tai, Pinyin News, December 30, 2011

Attitudes in Hong Kong toward Mandarin: survey

Mandarin is less well loved in Hong Kong than most other “icons” of China, according to the results of a survey there.

Although the percentage of those who described themselves as “averse” (kàngjù) to Mandarin is quite small (in the single digits), it has quadrupled since 2006 (1.8% to 7.3%). (I’m using the English and Mandarin terms given in the source material.)

Meanwhile, the percentage of those who are “affectionate” (qīnqiè) toward Mandarin has dropped, though not to an all-time low. And the percentage of those who are “proud” (zìháo) of Mandarin is also down, though it remains much higher than it was in 1994 when the survey began.

Affection toward, pride in, and averseness to Mandarin in Hong Kong, 1994-2010
graph showing affection toward Mandarin in the 27-35% range, pride in Mandarin rising from 19% to 34% percent but dropping since 2006, and aversion to Mandarin at around 3% until the climb to about 8% in 2010

Interestingly, averseness to Mandarin has been growing, while averseness to most other mainland icons has been dropping.

In the graphs below I have omitted some surveyed icons — Hong Kong’s regional flag/emblem, the night view of Victoria Harbor, the Legislative Council building, the Hong Kong and Shanghai Bank Building, and the Bank of China Building — to keep the graphs from getting too busy looking and because those are within Hong Kong itself.

The lines for Mandarin are in dark red. Click to enlarge the images to a useful size.

Percentage of respondents feeling “averse to” Mandarin (“Putonghua”) and other Chinese icons
graph

Percentage of respondents feeling “affectionate towards” Mandarin (“Putonghua”) and other Chinese icons
graph

Percentage of respondents feeling “proud of” Mandarin (“Putonghua”) and other Chinese icons
graph

But even though Mandarin hasn’t gained much affection recently from the people of Hong Kong, it’s still far more liked than the least popular of the PRC’s institutions: the police (gōng’ān).

sources and further reading:

China and U.S. study abroad programs

China remained the fifth most popular destination for U.S. students studying abroad during the 2008/09 school year, and it continued to account for 5 percent of U.S. study abroad.

In the previous academic year, growth for the PRC as a destination increased 19.0 percent, while study abroad as a whole increased 8.5 percent. But for 2008/09 growth for China was a much smaller 3.9 percent, while the total worldwide figure declined -0.8 percent. Figures for the top four destinations also dropped.

The order of the top 10 remained the same as in the previous year, except Mexico and Germany switched places.

Top 10 destinations for study abroad by U.S. students in the 2006-07, 2007-08, and 2008-09 school years
China shown as the fifth most popular destination for study abroad. The top destination is the U.K., followed by Italy, Spain, and France. See the link to my source material for the actual numbers.

Some other figures of possible interest:

  • Japan was in 11th place with 5,784 students, a 1.3 percent increase over the previous year.
  • Taiwan’s total grew 3.3 percent to 597.
  • Hong Kong grew 5.7 percent to 1,155.
  • South Korea grew a dramatic 29.1 percent to 2,062.
  • Singapore grew 7.7 percent to 612.

Study in Asia increased slightly.

Percent of study abroad performed in Asia
chart showing percentage of study abroad in Asia flat at about 6% from 1996-2000, with growth increasing since 2003 to the present 11.1% for the 2008-09 school year

source: Open Doors data portal

Previous posts on this subject:

China and U.S. study abroad programs

China has become the fifth most popular destination for U.S. students in study abroad programs, according to the results of a newly released study.

Top 10 destinations for study abroad by U.S. students in the 2006-07 school year
China shown as the fifth most popular destination for study abroad. The top destination is the UK, followed by Italy, Spain, and France.

It was only a few years ago that China made it into the top ten for the first time.

Top 10 destinations for study abroad by U.S. students in the 2000-01 school year
China shown as the tenth most popular destination for study abroad. The top destination is the UK, followed by Italy, Spain, and France.

The trend evident by comparing the two graphs is also backed up by the numbers: There has been a tremendous increase in the number of American students receiving credit for study abroad.

This latest increase marks a decade of unprecedented growth in the number of American students receiving academic credit for their overseas academic experience, with an increase of close to 150%, from under 100,000 in 1996/97 to nearly a quarter of a million in 2006/07.

Moreover, there has been an increasing interest in non-traditional destinations. In 1996-97, Europe took in 64 percent of U.S. students studying abroad. Although it continues to attract a majority (57 percent) of such students, many other destinations are receiving more students than ever, “fueled in part by an increase in new program opportunities, partnerships between higher education institutions in the United States and abroad, and a range of fields and program durations to accommodate the needs of an increasingly diverse study abroad population.”

Percent of study abroad performed in various parts of the world, 2006-07
Europe 57%, Latin America 15% , Asia 10%, Oceania 6%, Africa 4%, Middle East 1%, multiple destinations 7%

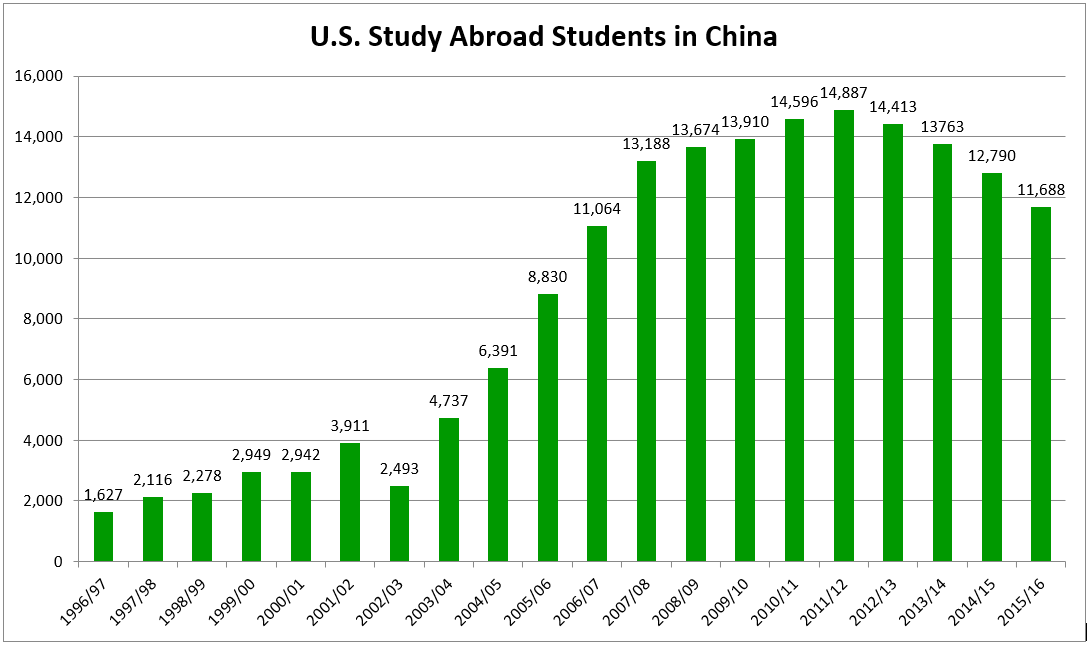
China’s growth as a destination has been strong this decade, other than a dip during the SARS outbreak. Note, however, that China has yet to receive even 5 percent of U.S. study abroad students in any given year, so please don’t misinterpret this post as yet more media hype proclaiming “Everyone’s going to China!” (For the 2006-2007 school year, the figure was 4.6 percent.)

Percent of study abroad performed in select Asian destinations, 1996-2006
percentage of study abroad students in select Asian destinations, 1996-2006; sharp growth for China; also dramatic growth for India, but from a lower baseline; Japan stays flat

The growth of interest in China has helped fuel Asia taking in greater numbers of students. Taiwan has also more than doubled the percentage of U.S. study abroad students it takes in, though the percentage remains so low that this is difficult to see on the graph.

Percent of study abroad performed in Asia, 1996-2006
dfdfd

Note that there’s no indication of just how long people stayed in given destinations. So it’s possible that students spent much more time on average in, say, England than in China — or vice versa.

Here’s the overall breakdown for the time students spent studying abroad:

  • 55% in short-term programs (“including summer, January term and any program of 2 to 8 weeks during the academic year”)
  • about 36% in semester-long programs
  • over 40% in mid-length programs (one semester, one quarter or two quarters)
  • less than 5% spend a full academic or calendar year abroad

source: Open Doors 2008: Report on International Educational Exchange

Further reading for students interested in study abroad: IIEPassport Study Abroad Funding.
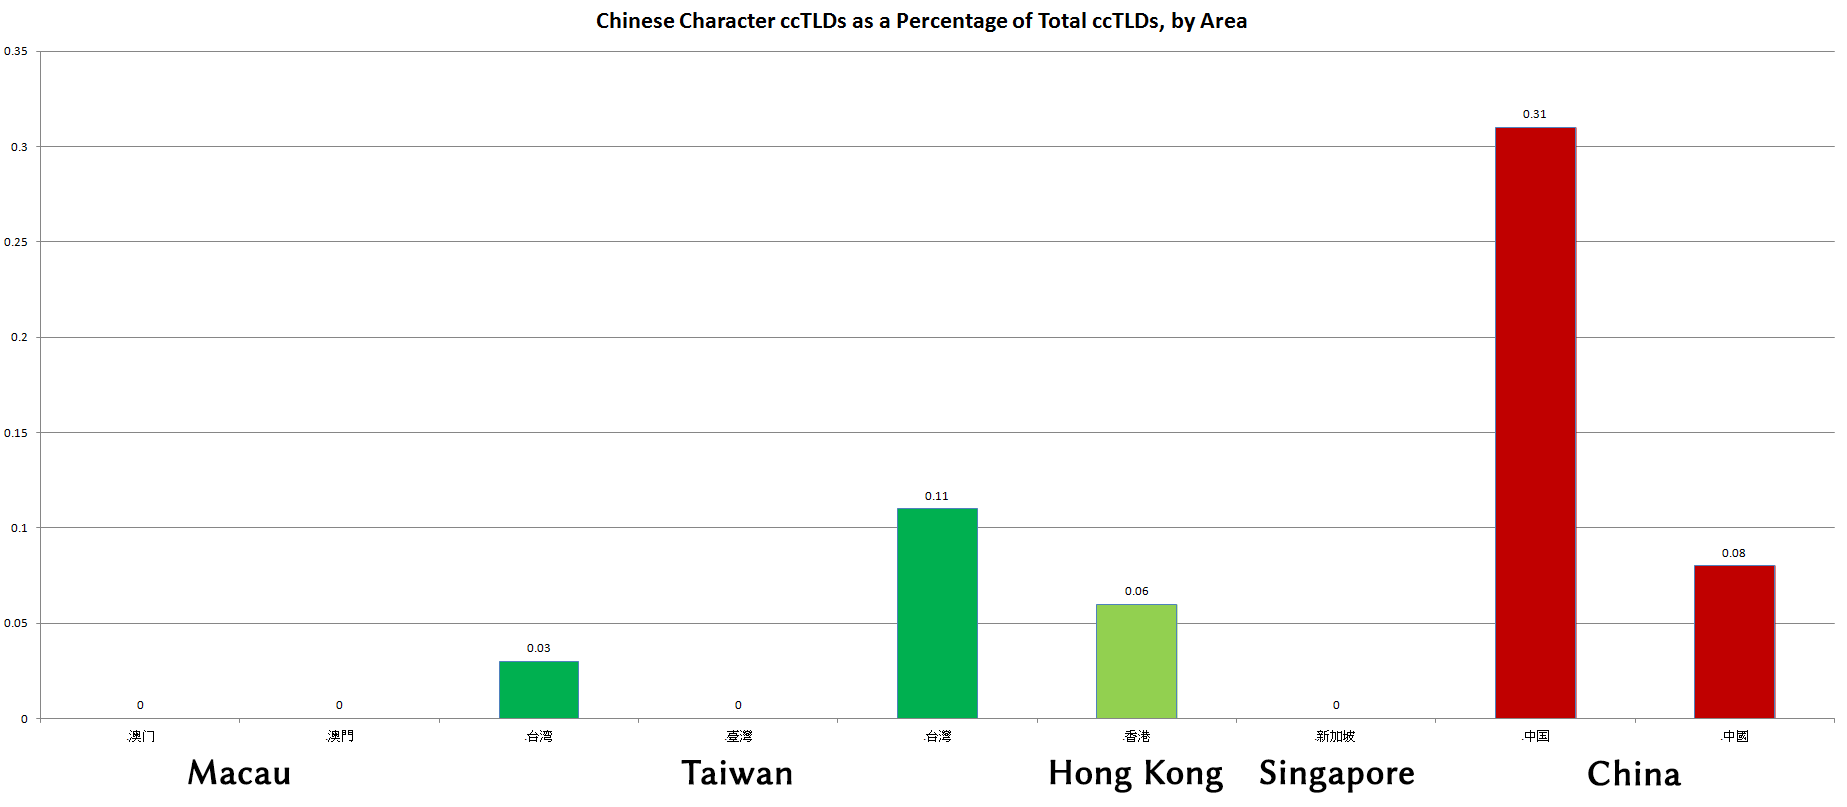