AP language exams and Chinese in U.S. high schools

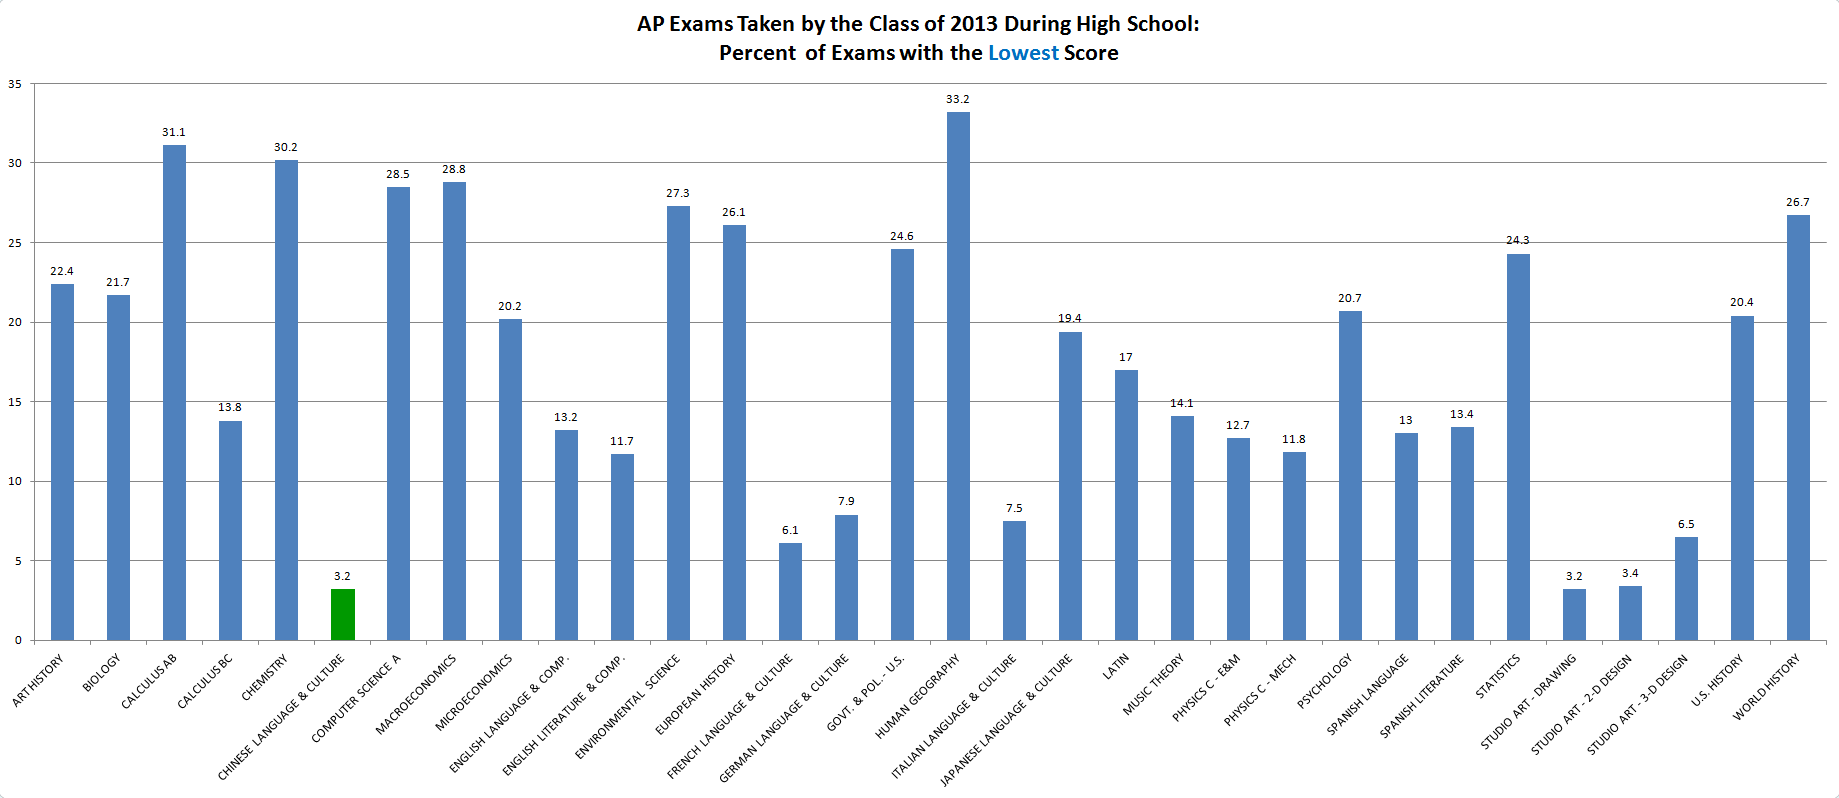
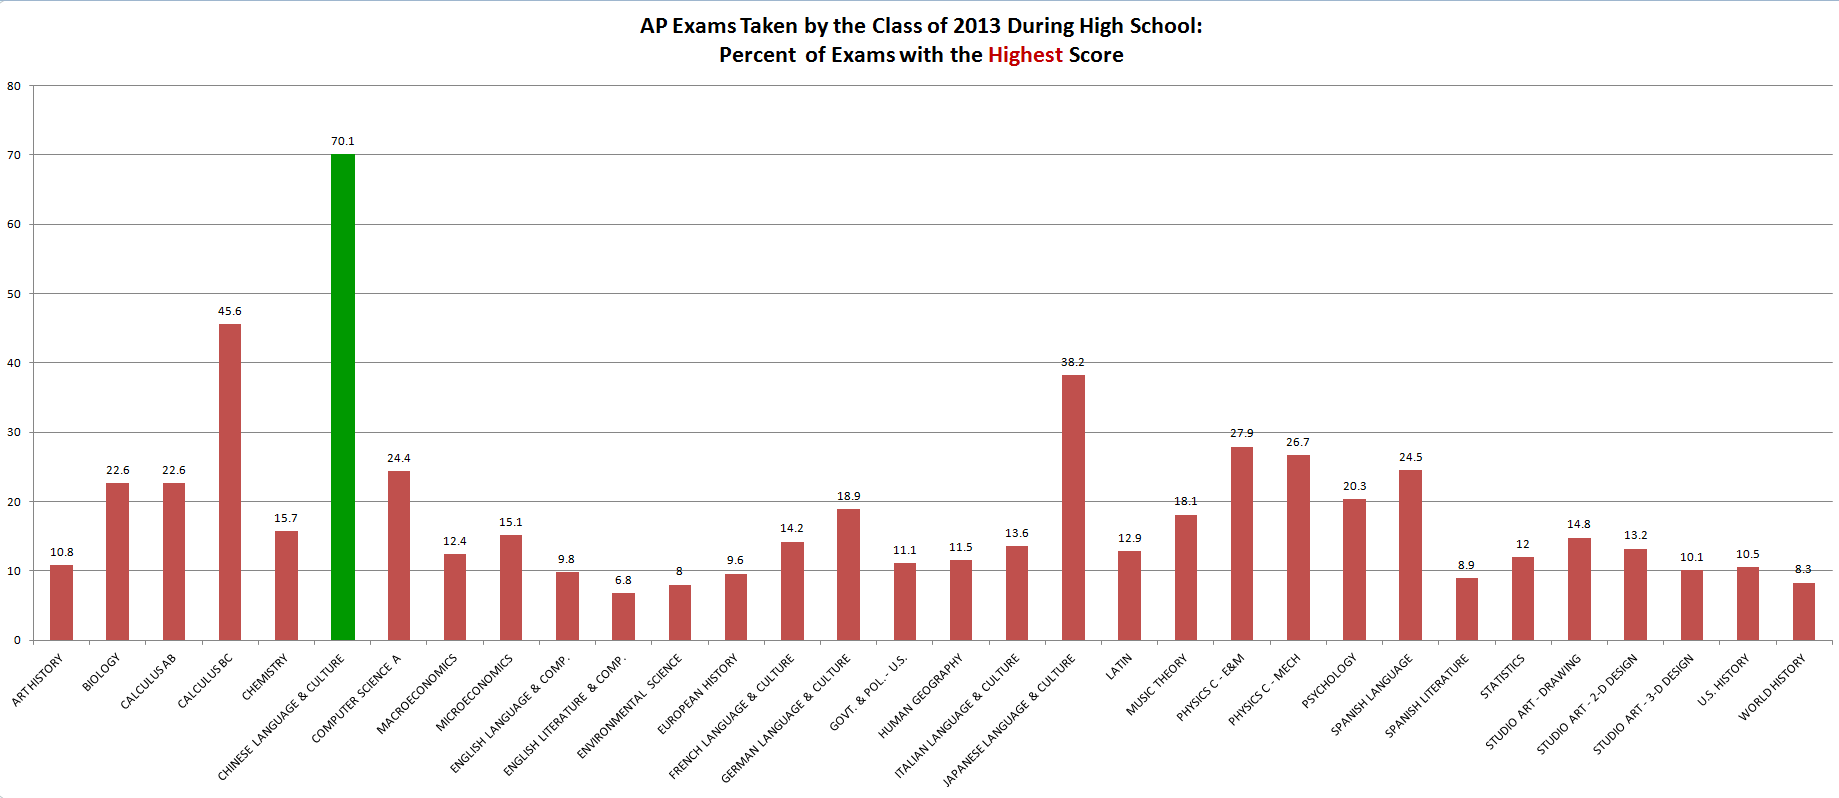
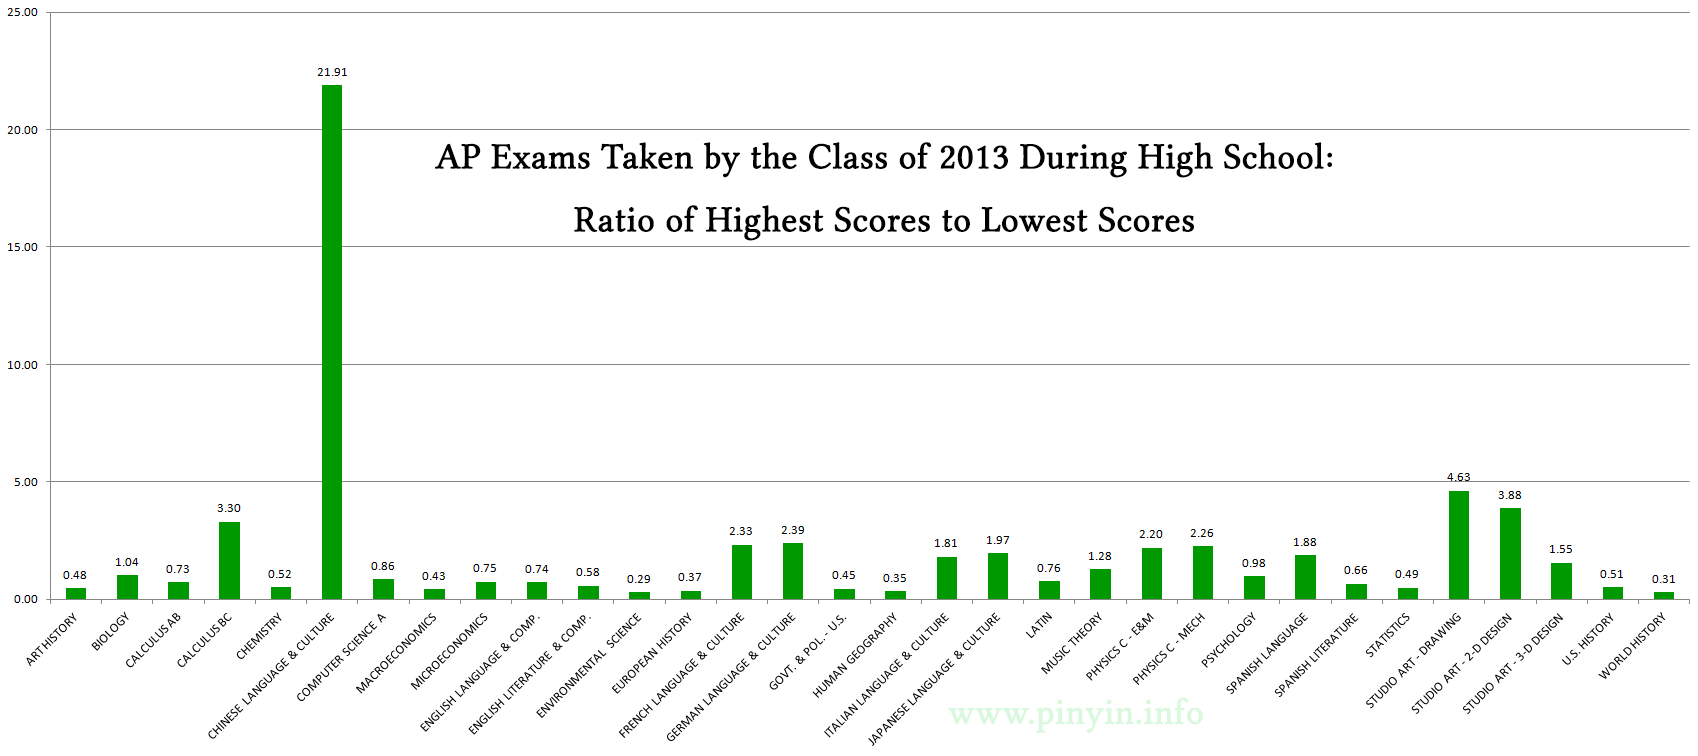
Today I’m continuing my look at the U.S. high school Advanced Placement foreign language exams, focusing especially on the AP exam in Chinese Language and Culture. (See also AP exams: using highest and lowest scores to look at the case of Chinese.)In the graphs below, “Chinese” is the first column on the left.

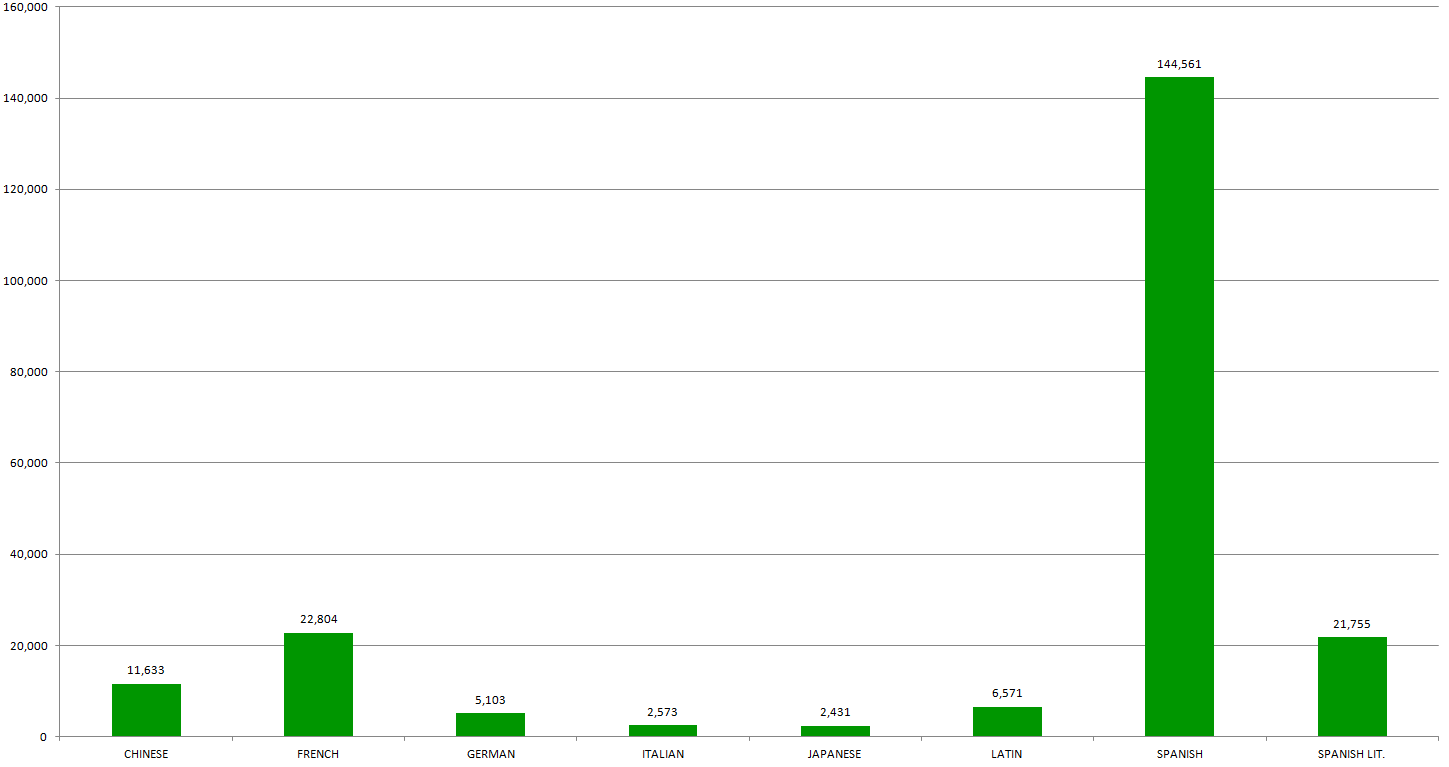
The first and obvious point from graphing the numbers of high school students from the class of 2015 who took an AP foreign language exam is the dominance of Spanish. Combined, the exams for Spanish Language and Spanish Literature outnumber all of the other language exams put together … times three.

ap_language_exam_totals

Now let’s look at the figures above broken down into the grade during which people took the exam. As you can see, there’s something different about when people take the Chinese exam. For all other foreign languages, most people take the exam their senior year. But the Chinese Language and Culture exam is most often taken by juniors.

ap_language_exams_by_grade

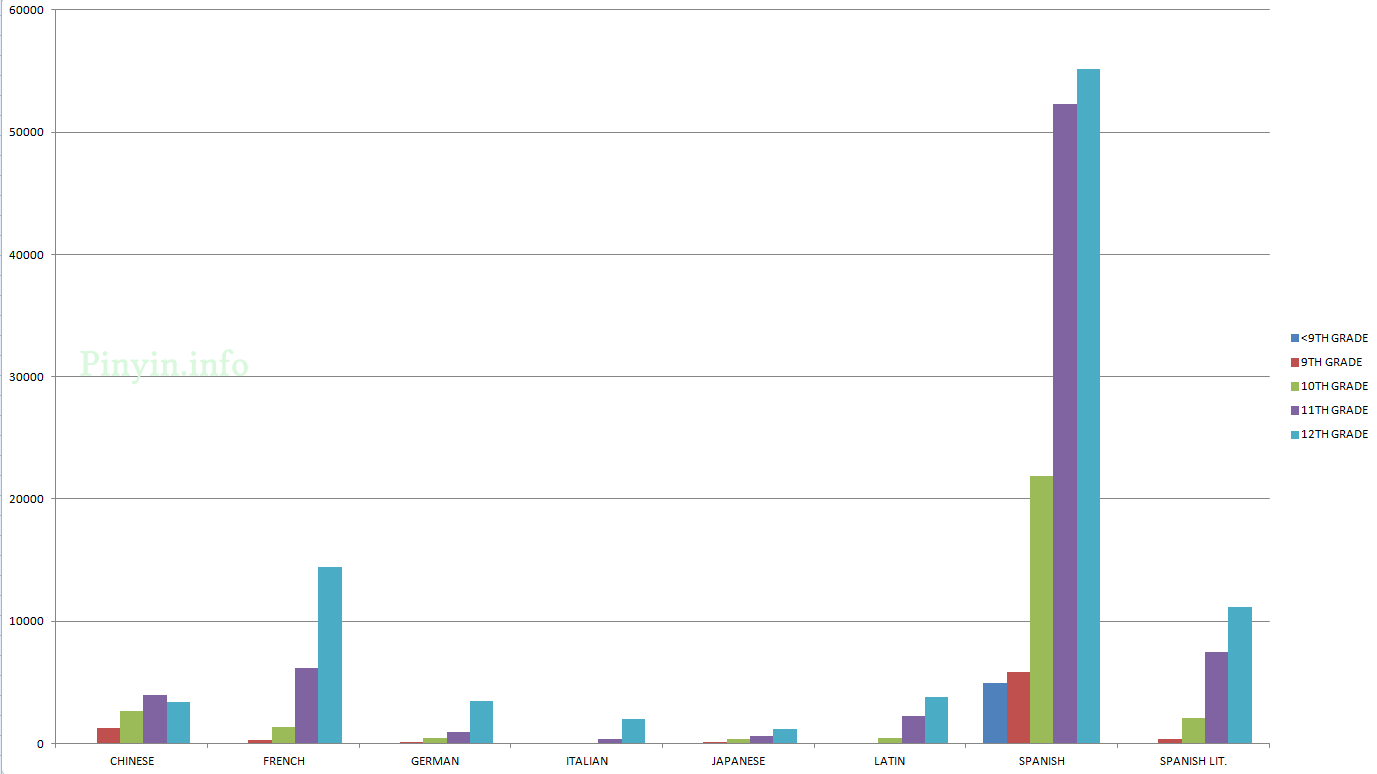
That’s a little lopsided. So let’s take Spanish and Spanish Lit. out of the mix so we can compare the other languages more easily.
ap_language_exams_by_grade_wo_spanish

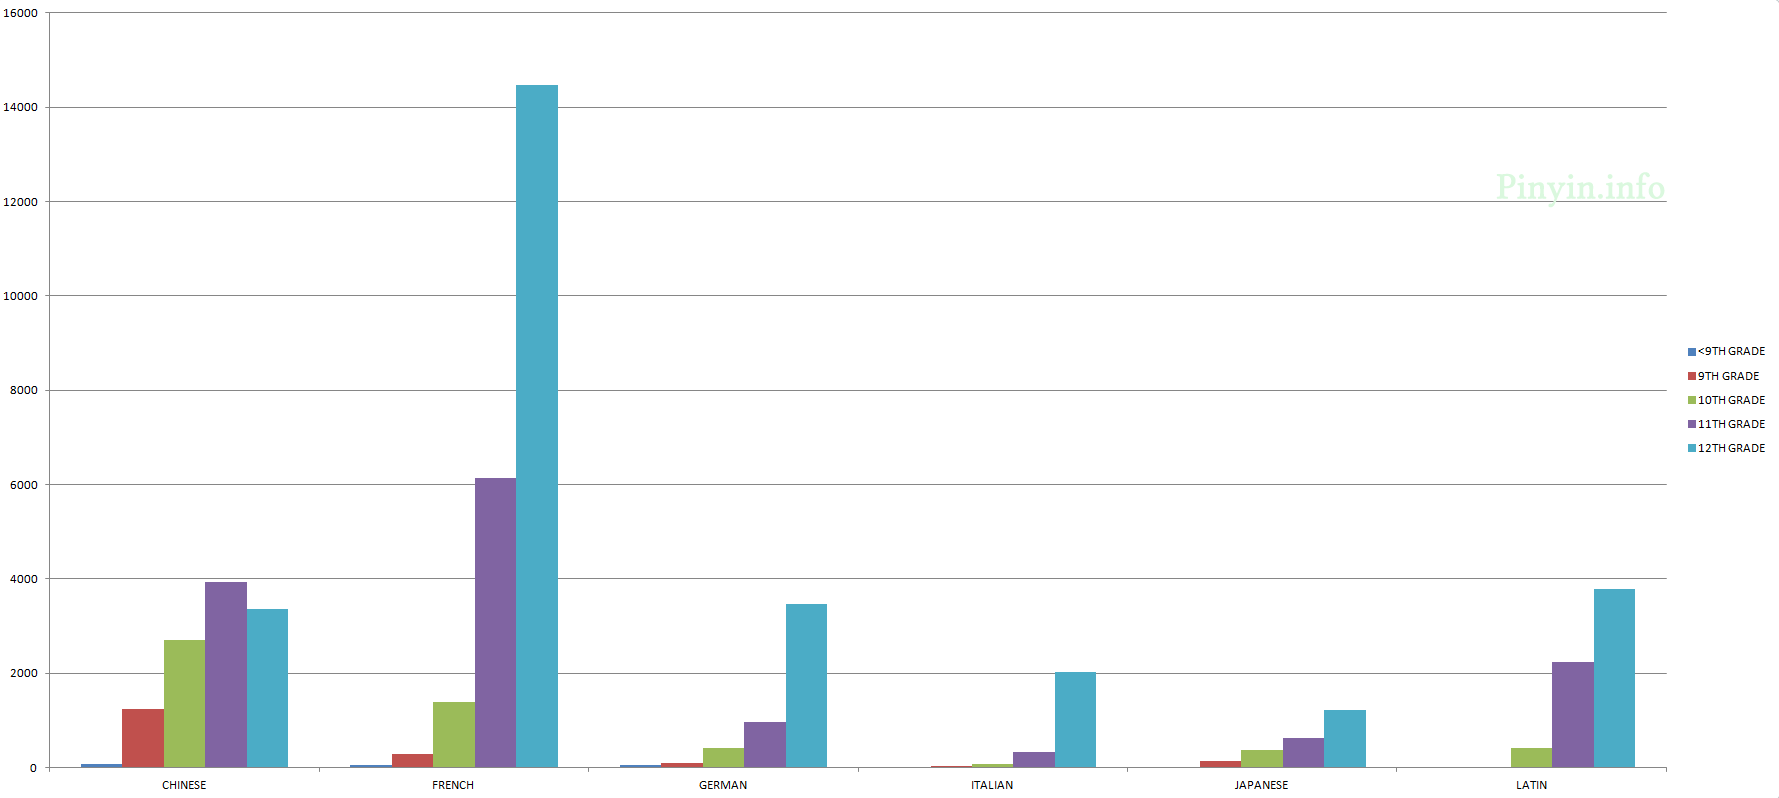
In just a few years Chinese has grown to be the third-most popular AP foreign language exam, behind Spanish and French. OK: way, way behind Spanish and about half of the number that French has. And Chinese comes in fourth if you count Spanish Literature. Still, Chinese now has more test takers than German. And it has more than Latin, Italian, and Japanese put together. But — you knew there’d be a but — the numbers for the AP Chinese Language and Culture exam are relatively large because most of the people who take it already know the language and didn’t learn it in an AP class. That is reflected in the charts above showing when people took the exam. (Note that Spanish also has a relatively high number of juniors taking the exam.)

The closest measure we have for native speakers and others with a much higher level of exposure to the language in question than other students is what students indicate themselves to the College Board on their answer sheets. Here’s how the College Board defines a “standard” student: They “generally receive most of their foreign language training in U.S. schools. They did not indicate on their answer sheet that they regularly speak or hear the foreign language of the exam, or that they have lived for one month or more in a country where the language is spoken.”

Here are the numbers for “standard” students in 2015 across various languages.

AP_2015_foreign_language_exams_standard

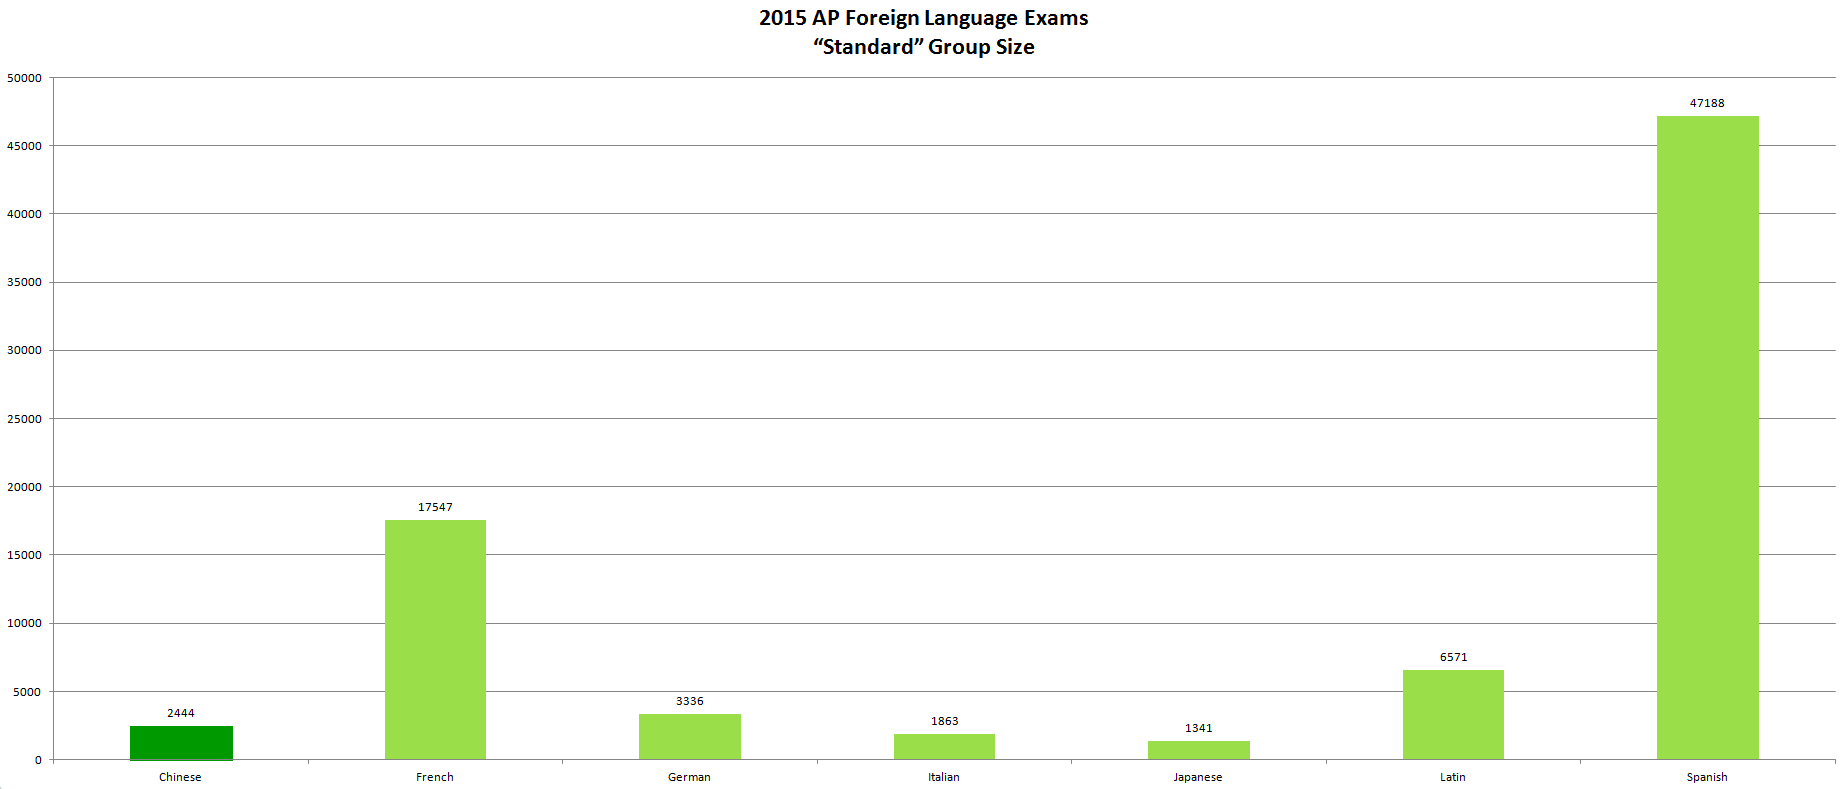
In this, Chinese drops from third place to fifth, behind Spanish, French, Latin (which is without a question on the standard group), and German, but still ahead of Italian and Japanese. When all test-takers are considered, AP exams in French outnumber those in Chinese by a little less than 2:1, which sounds very impressive (and, to some degree, it is). But when only the standard groups are considered, AP exams in French outnumber those in Chinese by more than 7:1.

Later in this series, we’ll look further at both the standard group and those not in it.

AP exams: using highest and lowest scores to look at the case of Chinese

The results of the Advanced Placement exams from the College Board can give us an idea of what’s going on with the teaching of Mandarin Chinese in U.S. high schools.

As the charts below demonstrate, there’s something very different about the scores for the AP exam in Chinese Language and Culture compared with the scores for just about everything else.

The tests are graded on a five-point scale, with a 5 being the top score. Generally, a 3 is considered a pass, though some universities choose to give or deny credit based on different scores.

The first chart shows the percentage of of test takers who received a score of just 1 (lowest) on their respective AP exams. The median of the figures below for the percentage of test takers who received the lowest score is 18.2. The figure for Chinese (in green, at 3.2) is just 0.18 times that. Studio Art Drawing and Studio Art 2-D Design are at about the same level here as Chinese Language and Culture. But everything else is at least twice that — in most cases many times that.

AP Exams Taken by the Class of 2013 During High School: Percent of Exams with the Lowest Score
AP_exams_percent_with_bottom_score
(click any chart to enlarge it)

So, relatively speaking, almost no one received the lowest score on the AP Chinese Language and Culture exam.

What about the highest score? The median of the figures below for the percentage of test takers who received the highest score (of 5) on their respective AP exams is 13.9. The figure for Chinese is 5.0 times that.

AP Exams Taken by the Class of 2013 During High School: Percent of Exams with the Highest Score
Advanced Placement exams, showing the percentages earning the top score on different AP tests

Finally, below is a chart putting the differences into greater perspective. It shows the ratio of highest scores to lowest scores on various AP exams.

The median of the figures below for the ratio of highest scores to lowest scores on the AP exams is 0.8. The figure for Chinese is 27.1 times that.

As is obvious from the image below, nothing else is even close.

AP Exams Taken by the Class of 2013 During High School: Ratio of Highest Scores to Lowest Scores
AP_exams_2013_highest_vs_lowest_scores

The reason for this massive difference is that the Advanced Placement exam for Chinese Language and Culture is taken mainly by native speakers and others who generally have not had to learn most of their Mandarin in their high school AP classes. This doesn’t bode well for newcomers to the language who want to learn. But as lopsided as the situation is, things are improving. More on that in later posts.

source: The 10th Annual AP Report to the Nation, February 11, 2014

See also Results of US AP exams: first year for Mandarin, Japanese, Pinyin News, February 14, 2008.

Pinyin font: Noto

I shouldn’t go too long without mentioning Google’s ambitious Noto project, which offers both serif and sans-serif versions: Noto Serif and Noto Sans.

When text is rendered by a computer, sometimes there will be characters in the text that can not be displayed, because no font that supports them is available to the computer. When this occurs, small boxes are shown to represent the characters. We call those small boxes “tofu,” and we want to remove tofu from the Web. This is how the Noto font families got their name.

Noto helps to make the web more beautiful across platforms for all languages. Currently, Noto covers over 30 scripts, and will cover all of Unicode in the future. This is the Sans Latin, Greek and Cyrillic family. It has Regular, Bold, Italic and Bold Italic styles and is hinted. It is derived from Droid, and like Droid it has a serif sister family, Noto Serif.

Noto fonts for many other languages are available as web fonts from the Google Web Fonts Early Access page.

Noto fonts are intended to be visually harmonious across multiple languages, with compatible heights and stroke thicknesses.

(Emphasis added.)

And it’s free, of course.

noto_serif_font

noto_sans_font

Diing Dong

A doubled vowel is a sure sign of the Gwoyeu Romatzyh romanization system — except when it’s a sign of someone wrongly omitting an apostrophe in Hanyu Pinyin or simply making a typo. But today’s example is certainly Gwoyeu Romatzyh, as, oddly enough, the side of a coach bus is one of the most likely places in Taiwan to spot an example of that romanization system. I’m seeing it less and less as the years go by, though, which saddens me.

Here, however, is a nice example that looks fairly new. I took the photo along Taidong’s lovely coastline a couple of weeks ago.

Diing Dong Bus (Pinyin: Ding3 Dong1; lit. ancient three-legged round cauldron, east)

Note, too, the mixing of Mandarin and English (rather than the loanword form of bashi), and those hideously misplaced g’s.

photo of a coach bus, with 'Diing Dong Bus' in large letters on the side, with the bottom of the descenders on the g's sitting on the baseline

China down slightly as destination for U.S. study abroad students

Rapid growth in U.S. students going to China to study has not been seen since around 2008. In fact, in the most recent school year for which we have data (2012–2013), the total fell to 14,413, down slightly from the 14,887 U.S. students studying in China during the 2011–2012 school year.

US_study_abroad_students_in_China
Meanwhile, the number of students from China studying in the United States is back on the rise.

Note, the chart below is not of the absolute number of Chinese students in the United States but of the ratio of Chinese students in the United States to U.S. students in China — just because I thought it might be more interesting. If you’d like to the see the numbers for the former, then check the source document.

Students from the People's Republic of China in the United States per U.S. student in China

China is the leading place of origin for students coming to the United States, with Chinese students comprising 31% of international students in the United States. They’re about evenly divided between undergrad and grad students.

Source: Open Doors Fact Sheet: China.

Growth in US postsecondary Mandarin enrollments stalls

Back in 2008 I took a close look at U.S. post-secondary enrollments in foreign languages and the position of Mandarin. I’ve recently been examining the latest figures (for which there is still a lag of a couple years).

I’ve included data for all available years, other than 1969 and a couple years in the early 1970s because the numbers were calculated differently then.

These represent the total enrollments for courses labeled “Mandarin” or some form of “Chinese” (including “classical” but excluding modern languages such as Cantonese, Taiwanese, etc.). Failure to add the sometimes separately categorized “Mandarin” to the figures for “Chinese” would produce the wrong results.

As can be seen in the graph below, over the most recent period (2009–2013) growth in enrollments in Mandarin in U.S. universities basically came to a halt, increasing just 0.6 percent. I do not expect a return to the dramatic increases common before 2009.

graph of enrollments in Mandarin Chinese in U.S. universities, including 26,471 in 1995, 28,456 in 1998, 34,153 in 2002, 51,381 in 2006, 61,612 in 2009, and 61,968 in 2013
Click to enlarge.