AP exams: using highest and lowest scores to look at the case of Chinese

The results of the Advanced Placement exams from the College Board can give us an idea of what’s going on with the teaching of Mandarin Chinese in U.S. high schools.

As the charts below demonstrate, there’s something very different about the scores for the AP exam in Chinese Language and Culture compared with the scores for just about everything else.

The tests are graded on a five-point scale, with a 5 being the top score. Generally, a 3 is considered a pass, though some universities choose to give or deny credit based on different scores.

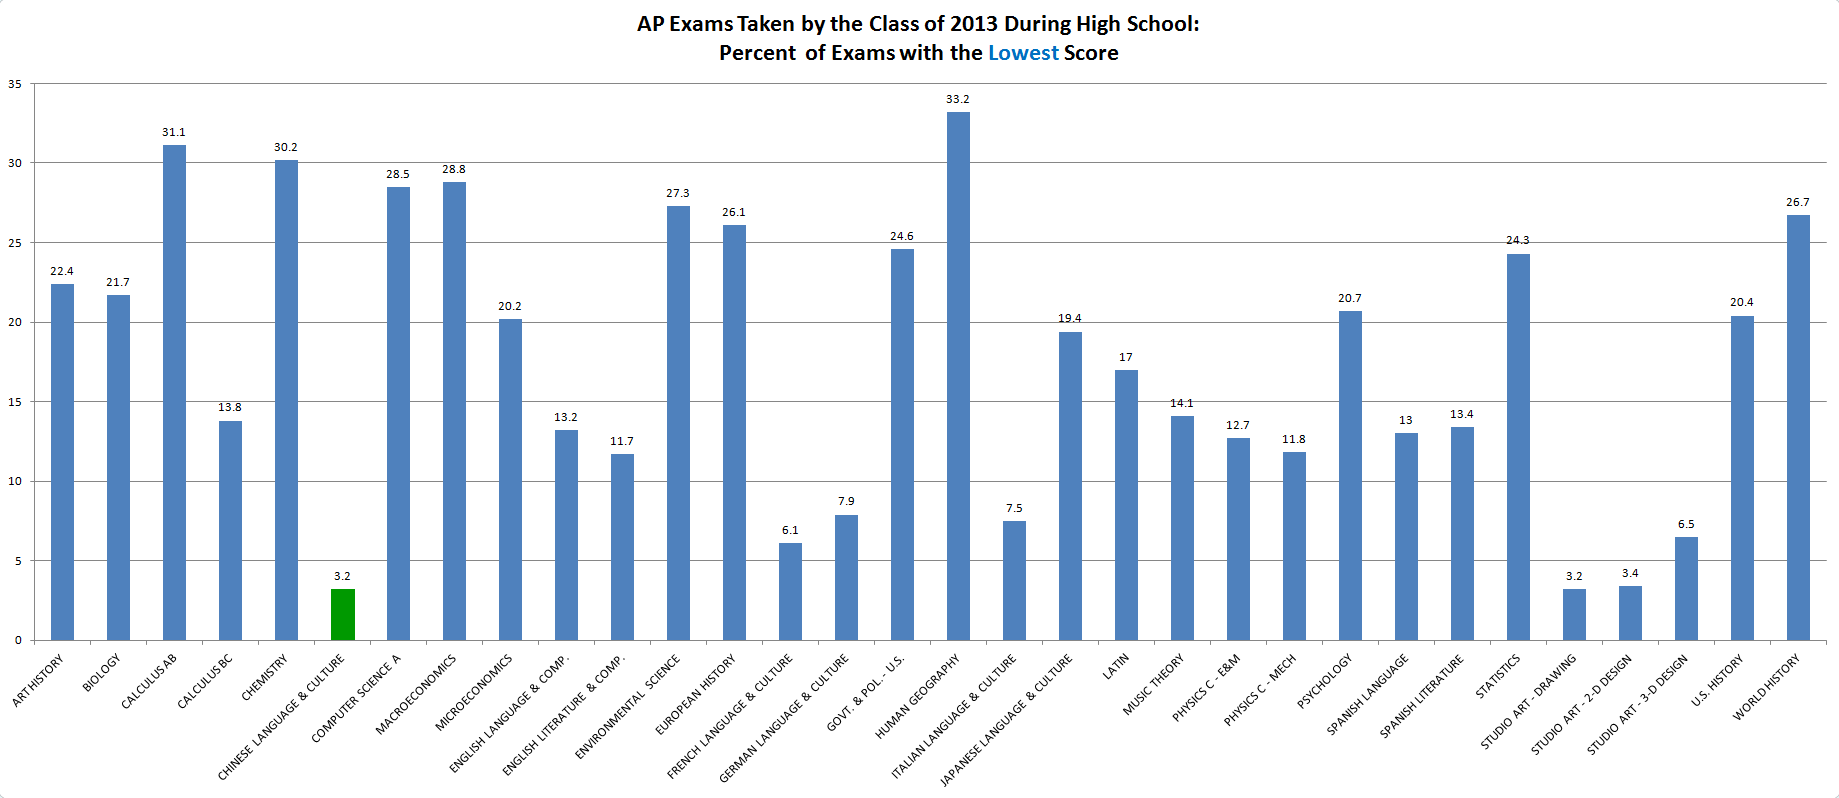
The first chart shows the percentage of of test takers who received a score of just 1 (lowest) on their respective AP exams. The median of the figures below for the percentage of test takers who received the lowest score is 18.2. The figure for Chinese (in green, at 3.2) is just 0.18 times that. Studio Art Drawing and Studio Art 2-D Design are at about the same level here as Chinese Language and Culture. But everything else is at least twice that — in most cases many times that.

AP Exams Taken by the Class of 2013 During High School: Percent of Exams with the Lowest Score
AP_exams_percent_with_bottom_score
(click any chart to enlarge it)

So, relatively speaking, almost no one received the lowest score on the AP Chinese Language and Culture exam.

What about the highest score? The median of the figures below for the percentage of test takers who received the highest score (of 5) on their respective AP exams is 13.9. The figure for Chinese is 5.0 times that.

AP Exams Taken by the Class of 2013 During High School: Percent of Exams with the Highest Score
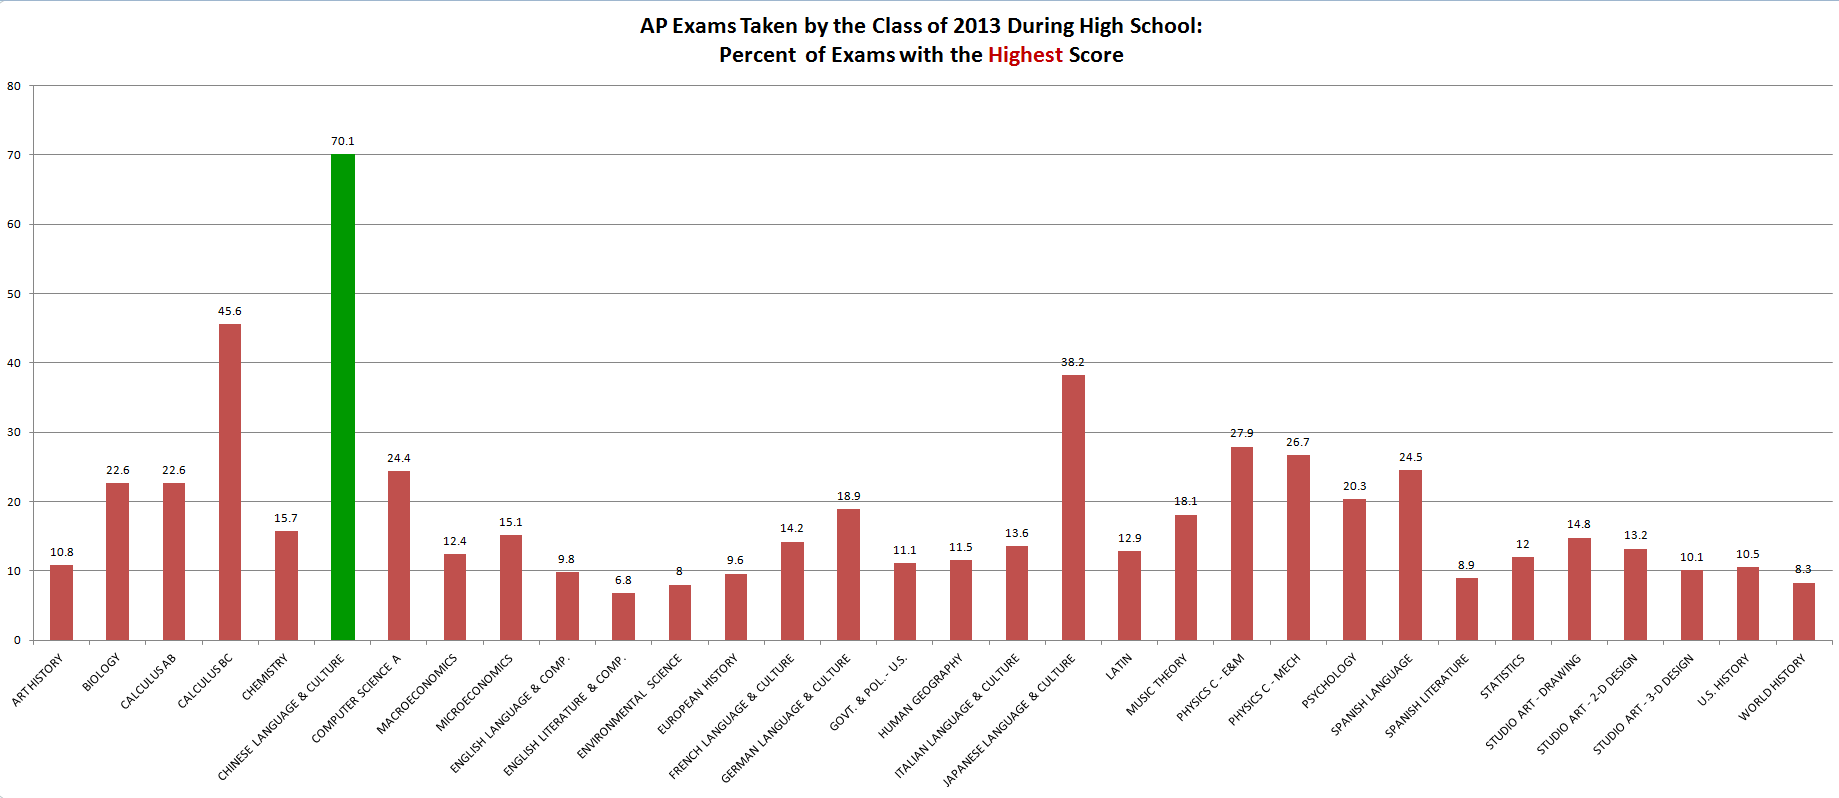
Advanced Placement exams, showing the percentages earning the top score on different AP tests

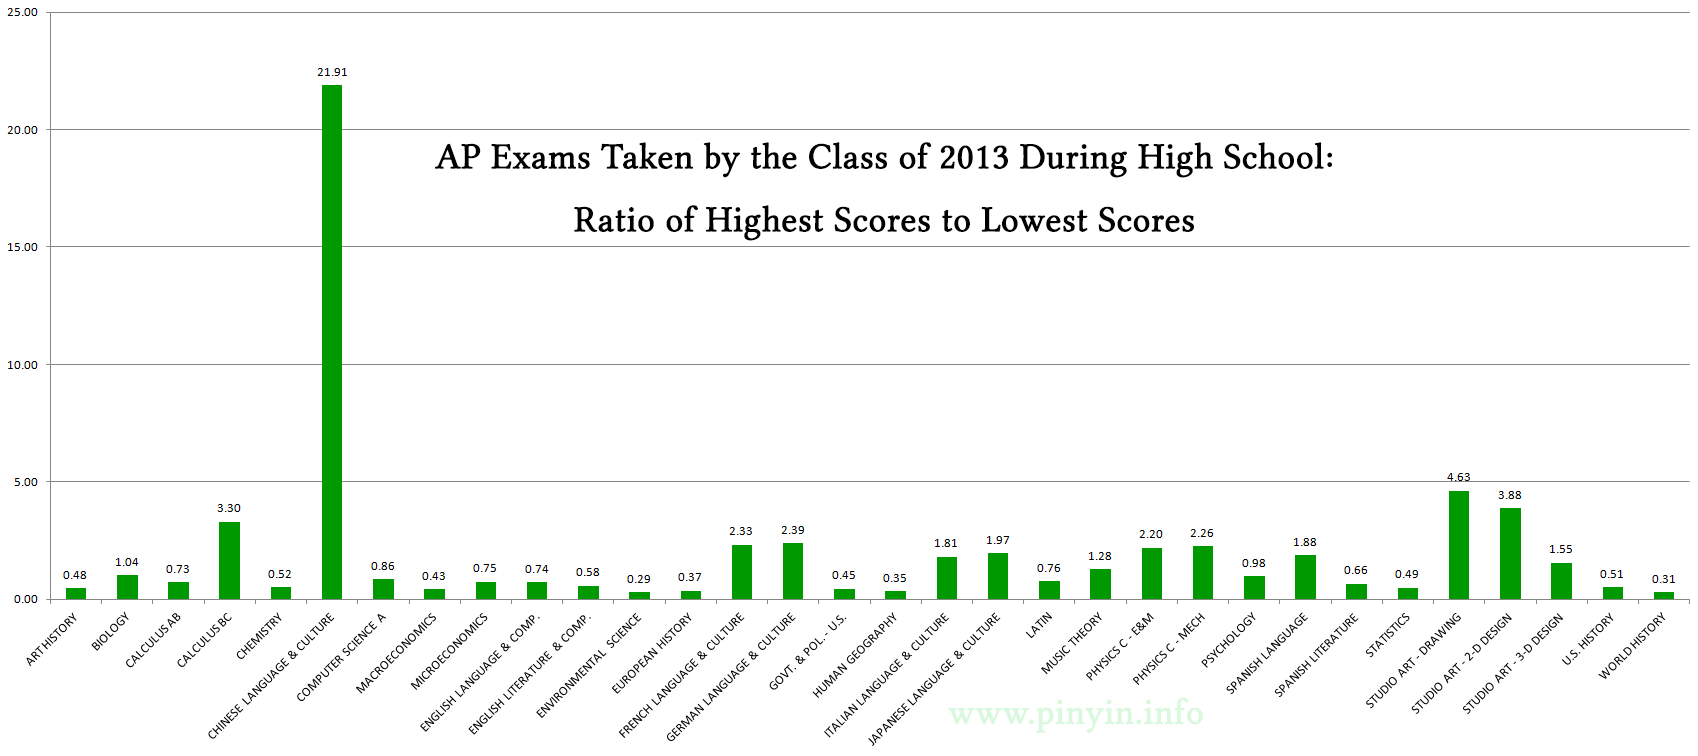
Finally, below is a chart putting the differences into greater perspective. It shows the ratio of highest scores to lowest scores on various AP exams.

The median of the figures below for the ratio of highest scores to lowest scores on the AP exams is 0.8. The figure for Chinese is 27.1 times that.

As is obvious from the image below, nothing else is even close.

AP Exams Taken by the Class of 2013 During High School: Ratio of Highest Scores to Lowest Scores
AP_exams_2013_highest_vs_lowest_scores

The reason for this massive difference is that the Advanced Placement exam for Chinese Language and Culture is taken mainly by native speakers and others who generally have not had to learn most of their Mandarin in their high school AP classes. This doesn’t bode well for newcomers to the language who want to learn. But as lopsided as the situation is, things are improving. More on that in later posts.

source: The 10th Annual AP Report to the Nation, February 11, 2014

See also Results of US AP exams: first year for Mandarin, Japanese, Pinyin News, February 14, 2008.

Results of US AP exams: first year for Mandarin, Japanese

2007 was the first year that the U.S. College Board offered an Advanced Placement (AP) exam for “Chinese Language and Culture.” It was also the first year students could take an AP exam in “Japanese Language and Culture.”

Data for the results as a whole have just been released. The figures for Mandarin are remarkably lopsided.

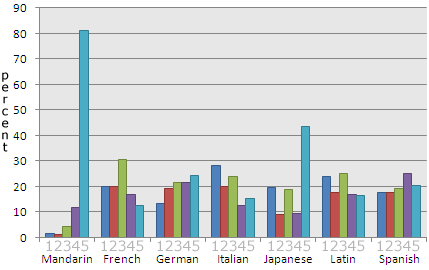
A total of 81.1 percent of those taking the exam for Mandarin and Chinese culture achieved the top score of 5, a much higher percentage than with any other test. The subject with the second highest percentage of 5’s was Japanese (43.4 percent), followed by Electricity and Magnetism (33.8 percent), Mechanics (26.1 percent), and German (24.4 percent). In most other subjects a score of 5 was achieved by only about 10 percent to 20 percent of test takers.

Let’s look at those who achieved only the lowest score (1). Here, too, Mandarin stands out, with by far the lowest percentage of test takers with this score (1.5 percent). Next are Drawing, 2-D Design, and 3-D Design (5.8 percent); English Language and Composition (10.9 percent); and Calculus BC (13.5 percent). Most subjects have “1” rates in the 20s.

Comparison of Scores Across Language Exams
chart comparing how well test takers did in various language exams, with scores for 'Chinese' being far higher than all others; languages listed: Mandarin, French, German, Italian, Japanese, Latin, and Spanish

Comparison of Lowest Scores Across Language Exams
comparing percentages of test takers receiving the low score of '1', with all languages other than Mandarin falling above 13% -- Mandarin at a mere 1.5%

So, does this indicate Mandarin isn’t damn hard for students after all or that the perfect pedagogy for this subject has been reached? Of course not.

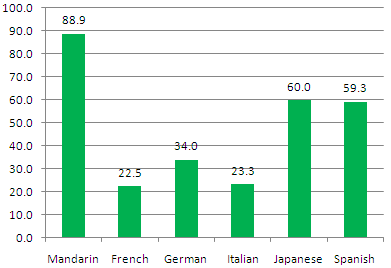
Only 11.1 percent of the 3,260 people taking the Mandarin exam did not indicate on their test that they “regularly speak or hear the foreign language of the examination at home, or that they have lived for one month or more in a country where the language is spoken.”

Percent of test takers who “regularly speak or hear the foreign language of the examination at home” or “have lived for one month or more in a country where the language is spoken”
chart showing that far more students taking the Mandarin AP exam are already speakers of that langauge

Thus, it’s no surprise to see that 89.4 percent of those taking the Mandarin exam identified themselves as “Asian, Asian American, or Pacific Islander.” Of all those across the entire United States who took the Mandarin exam last year, only 363 people did not identify themselves as falling within that category. This certainly does not match the hype about Mandarin as the foreign language being studied.

While I congratulate those who scored well on the exam (Chinese characters can certainly be a pain to learn regardless of your background), the test — and perhaps the curriculum, too — evidently needs considerable revision, which isn’t too surprising considering this was its first appearance. I’m a bit saddened, though, to see that more students from a wider variety of backgrounds aren’t taking up the challenge of Mandarin.

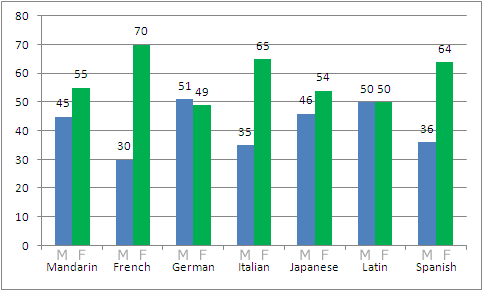
There doesn’t appear to be much of a gender imbalance, however, in AP Mandarin classes.

Percentages of students in AP language exams, by sex
chart showing the percentages of students in various AP language exams, by sex

Within a week or two I’ll be posting some interesting figures about U.S. post-secondary enrollments in Mandarin and other languages.

source: The 4th Annual AP Report to the Nation, College Board, February 13, 2008