
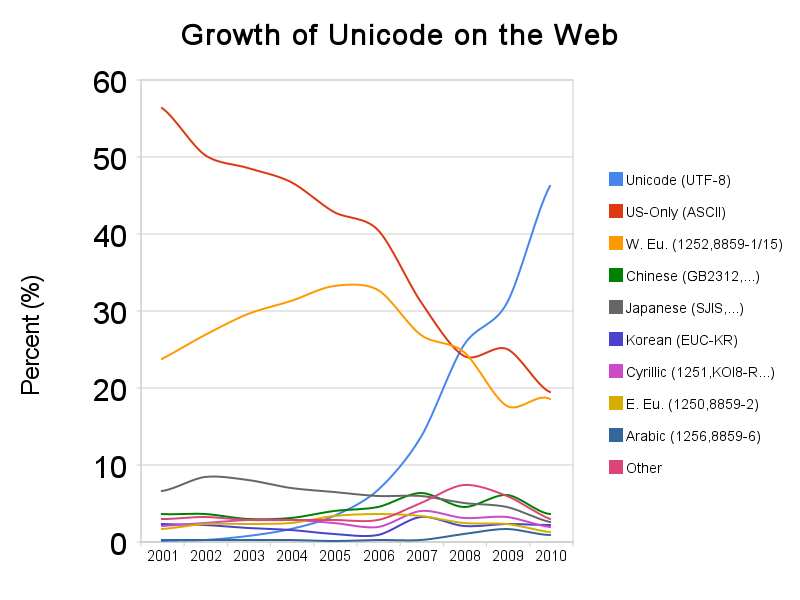
Some eight years ago UTF-8 (Unicode) became the most used encoding on Web pages. At the time, though, it was used on only about 26% of Web pages, so it had a plurality but not an absolute majority.
By the beginning of 2010 Unicode was rapidly approaching use on half of Web pages.
In 2012 the trends were holding up.
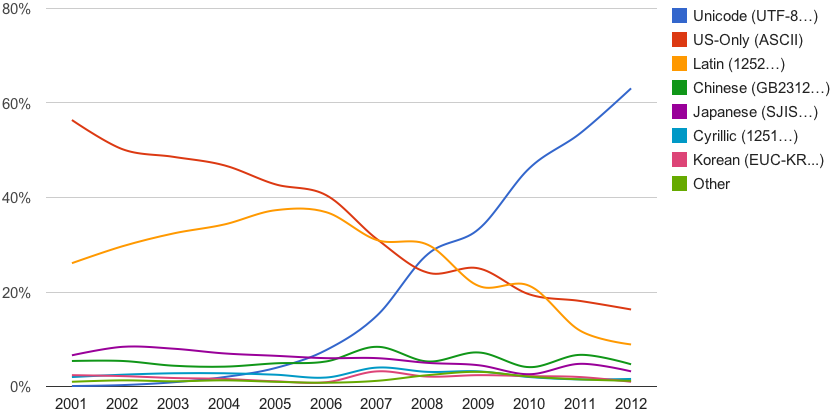
Note that the 2008 crossover point appears different in the latter two Google graphs, which is why I’m showing all three graphs rather than just the third.
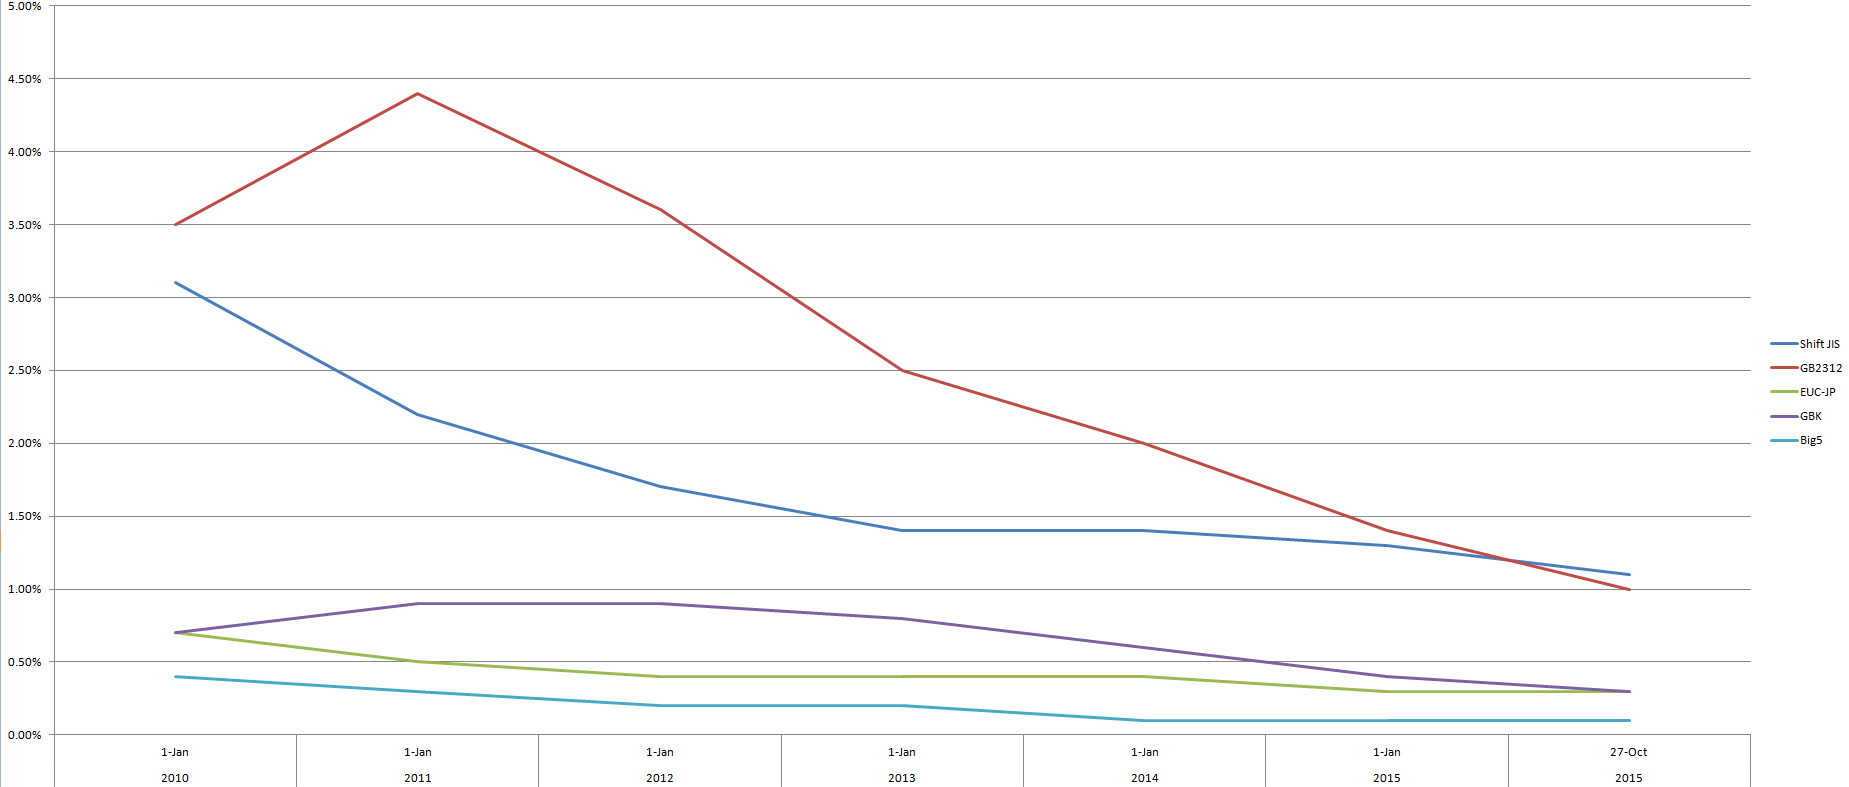
A different source (with slightly different figures) provides us with a look at the situation up to the present, with UTF-8 now on 85% of Web pages. Expansion of UTF-8 is slowing somewhat. But that may be due largely to the continuing presence of older websites in non-Unicode encodings rather than lots of new sites going up in encodings other than UTF-8.

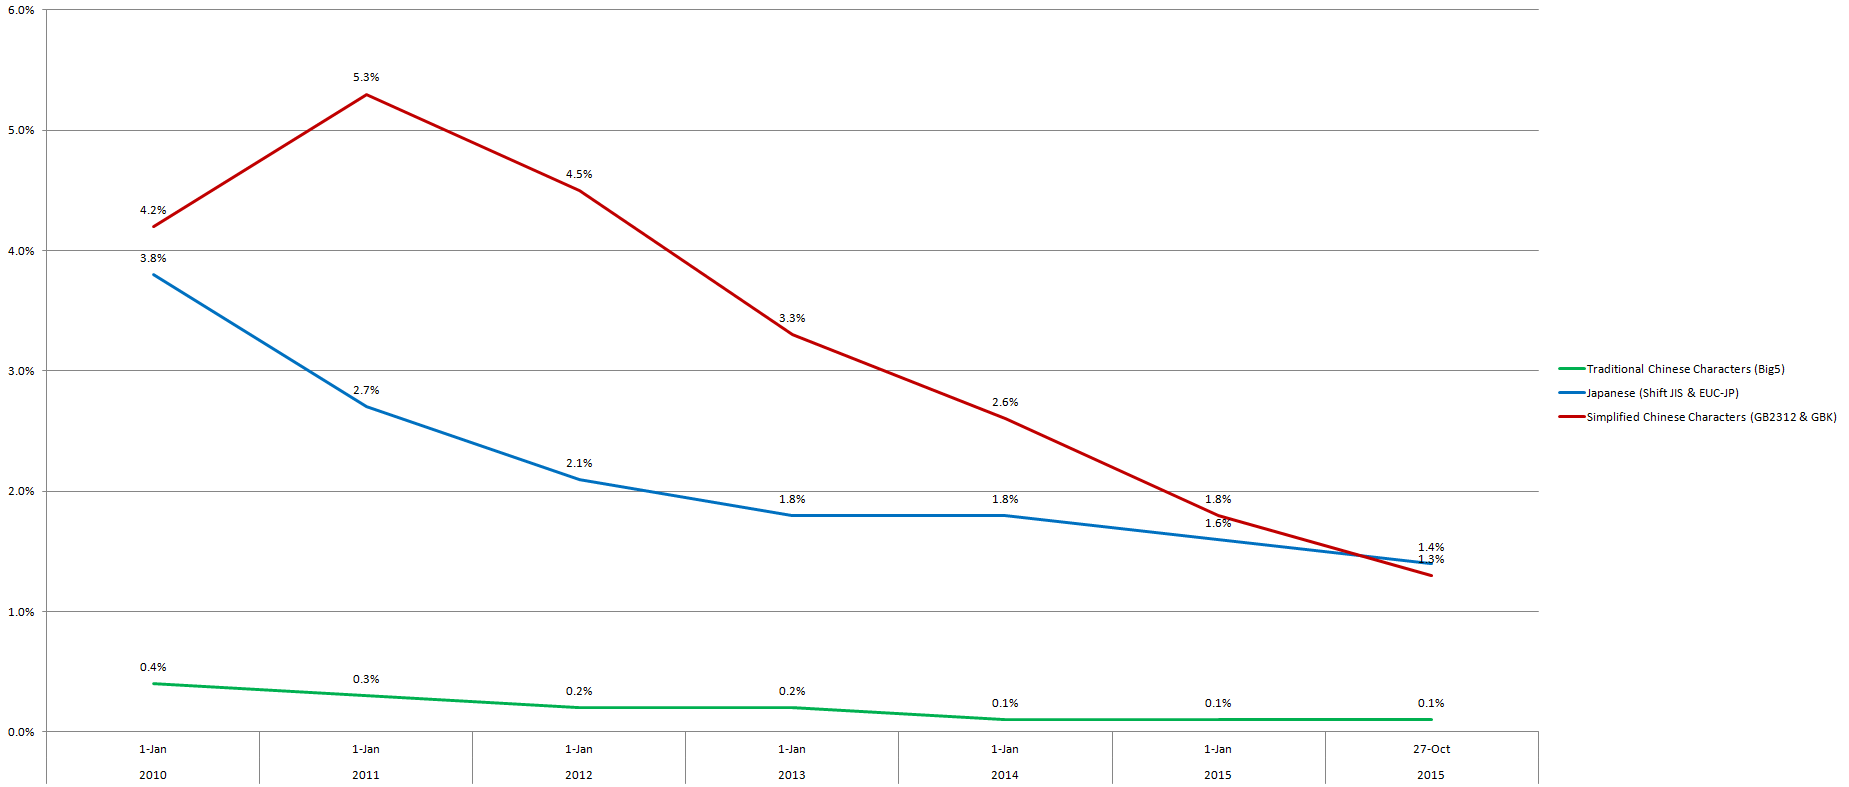
Here’s the same chart, but focusing on encodings (other than UTF-8) that use Chinese characters, so the percentages are relatively low.
And here’s the same as the above, but with the results for individual languages combined.
By the way, Pinyin.info has been in UTF-8 since the site began way back in 2001. The reason that Chinese characters and Pinyin with tone marks appear scrambled within Pinyin News is that a hack caused the WordPress database to be set to Swedish (latin1_swedish_ci), of all things. And I haven’t been able to get it fixed; so just for the time being I’ve given up trying. One of these days….
Sources:
- Unicode tops other encodings on Web pages: Google, May 7, 2008, Pinyin News
- Unicode nearing 50% of the web, January 28, 2010, Google Official Blog
- Unicode over 60 percent of the web, February 3, 2012, Google Official Blog
- Historical yearly trends in the usage of character encodings for websites, accessed October 27, 2015